

The Rise of Startups in a Post-COVID-19 World
A startup company is a company that is in it’s initial stages of it’s operations. The term “startups” has been more relevant in the recent times; the reason being the global pandemic that has shook the whole world and has disrupted the global economy. However it served as a golden opportunity for many new companies that would have lagged had such a crisis not occurred. Early data from 16 advanced economies suggest a significant divergence in startup activity. The number of new business applications in the United States shot up by 23 percent in the first three quarters of 2020 relative to the same period in 2019, before the COVID-19 pandemic struck. This is the largest increase of any country in the Organization for Economic Cooperation and Development (OECD) or the G20.
This is a clear sign of how the startups boomed during the global pandemic. There have been many reasons for such striking changes in the economy; the first reason is change in customer preferences that created an enormous number of opportunities for entrepreneurs and companies. For most cases this is due to the sudden focus on the internet based economy where more new and emerging companies could reach out to the wider audience. Thus it helped the investors in finding out potential companies that could boost the economy and investing in them. Second, the businesses tend to thrive in a place where the administrative processes for starting and making a business work is the easiest. Countries with a more expeditious process to start a business have been more likely to experience an uptick in business formation during the pandemic . This correlation leads to a simple policy recommendation: simplify business entry procedures as a COVID-19 recovery measure. A third hypothesis for the increase in business formation in some economies during the pandemic is attributed to entrepreneurship by necessity. All of these factors aided in the emergence and success of many small businesses or startup companies.
The coronavirus pandemic has unleashed a tidal wave of these entrepreneurial activity thus breaking countries with the strongest economies to break down and thus forcing the Americans to file paperwork to start 4.3 million businesses in the last two years. Applications are on a pace to be even higher this year. The surge is a striking and unexpected turnaround after a 40-year decline in U.S. entrepreneurship. In 1980, 12 percent of employers were new businesses; by 2018, the most recent year for which data is available, that share had fallen to 8 percent. This prolong major lag in the start ups worried the economists, thesis due to the fact that start ups play a major role and a key factor for the job growths. Thus after the pandemic John Lettieri, president and chief executive of the Economic Innovation Group, a Washington research organization, said… “the pandemic forced a big realignment that we never would have seen otherwise.” Thus, the pandemic benefitted a lot of lost companies and helped the economy from crashing down like it did during the Great Depression.
An example of a small business whose sales rose significantly during the global pandemic is Breath99. The company was found in April 2018. This company is a maker of reusable respirators. It had substantially-lower sales prior to the pandemic due to the obvious reasons of no masking policy being in place. However, the pandemic seemed to have a profound, resonating impact on the company, and the sales skyrocketed when masks were made mandatory during COVID-19. This growth was not just evident at Breath99 though, with thousands of mask companies, who were crashing and falling, had a hope of major growth during this crisis. The growth and the demand was such that it caused a major shortage of masks. There was more demand than supply. This not only helped the companies, but it encouraged the small mask makers companies to establish factories which further added to their growth. Though this process of growth did not start with a good note, it certainly allowed otherwise low-selling companies to thrive during the pandemic.
While these companies grew greatly during the pandemic, this growth raises the question of relevance, due to the fact that there is a possibility of these businesses plummeting once the pandemic ends. Therefore, there is no guarantee of durability of these companies. What should be done is that the government should provide security that after the pandemic ends they would be merged with other bigger and well established companies. "We don't know how 'sticky' these new business starts will be," says Keenan of the Virginia Small Business Development Center. "Some people start something to fill an immediate need, and then when the economy recovers, if their business hasn't been as fruitful as they wanted it to be, they may jump back into the job market."
In conclusion, with the emergence and establishment of startup companies and small businesses comes many risks, but the government should provide assurance so that every company has the oppurtunity to flourish in the economy.
The Role of Sticky-Price Core CPI in Forecasting Inflation
Officials of the Federal Reserve have been weary and bracing for a continued run of high inflation this spring, and the release of the Consumer Price Index data on April 12, 2022, confirmed this anticipation.
The CPI data released for March 2022 demonstrated an 8.5% increase from the previous year value of the CPI for all urban consumers and items, representing the highest annual rate seen in the American economy in four decades. The March 2022 CPI percentage-change was also a 0.6% increase of its high February 2022 value. At a seasonally-adjusted monthly frequency, the CPI increased by 1.2% in March 2022, the single-most-rapid month-over-month rise since 2005. The Core CPI, which excludes more volatile price data such as food and energy items, rose by 6.5% from its previous year value, and on a seasonally-adjusted monthly frequency, rose 0.3%.

The central bank began preparing their policies and systems for this ongoing propagation of increased inflation due to multitude of hard-to-predict, difficult-to-contain circumstances. These included the renewed COVID-19 lockdowns in major Chinese cities, as well as the sustained, high energy and commodity prices due to the Russian invasion of Ukraine and financial sanctions levied against Moscow. Given the uncertainty rampant in the American and international economy, members of the Federal Reserve Board of Governors have begun to show support for an interest rate increase that would lead the economy to a non-stimulating point and allow it to cool off, likely around 0.50 to start and with each subsequent increase made. While Fed officials will not officially decide on this rise till May, doing so could result in most aggressive and difficult policy-tightening efforts of the central bank in almost three decades.
Inflation, generally measured as the percentage change in the CPI market basket of goods in the current year against a base year, can be defined more loosely as a general increase in the overall price level of the available goods and services in the economy. While CPI may appear to be an effective variable to forecast future inflation on, the measurement encompasses a substantial level of volatility that can make significantly challenging for both policymakers and economic forecasters alike to distinguish between signals (of inflation) and noise (random volatility).
Economic theory suggests that the following relationships play a role in the CPI level for a given month:
Amount of slack in the labor market
Level of interest rates relative to the natural rate of interest in the economy
Size of money supply relative to productive capacity of the economy
These relationships would allow for a more robust, accurate forecast of the monthly CPI (and thus inflation). However, most of these relationships are not directly observable in the economy, and therefore make utilizing them in forecasting models for inflation difficult and even harmful to the model, especially under circumstances with higher volatility and uncertainty.
Additionally, expected inflation is often used as an indicator of future inflation in terms of price levels, but despite the theoretical dynamic between the two variables, expected inflation is biased upwards on average, and more so during economic recessions. The breakeven rate between regular, constant-maturity Treasury Securities and Treasury Inflation-Protected Securities (TIPS) is a stock market theorized predictor of CPI. However, the statistical information communicated from this system is more useful to understand the economic conditions surrounding a value of the CPI, rather than how the CPI will react to volatile fluctuations.

A methodology for forecasting CPI, and more generally inflation, using the sticky-price CPI was explored and proposed by Bryan and Mayer at the Atlanta Federal Reserve Bank. These sticky prices appear to capture future inflation than flexible prices, which seem to be more predictive of economic conditions more effectively.
Within the basket of goods and services used in computing the CPI, prices are categorized as being either “sticky” or “flexible”. Prior research on price categorization within the CPI basket of items has found that within the spending categories of CPI, half of them changed their prices at least every 4.3 months. Using this change frequency, the basket of forty-five CPI items can be grouped into sticky and flexible aggregates. If the prices for a particular CPI component fluctuate less often than every 4.3 months on average, it is classified as a sticky-price item, with those fluctuating more being grouped as flexible-price items.

The sticky-price CPI less food and energy is calculated using the subset of sticky-price items in the CPI each month, and is expressed as the percent change between the market value of the sticky-price-items basket in the current month and the value of this basket in the previous year.

A forecasting model for the seasonally-adjusted, percent-change in the econometric and statistical software package Stata was created for this article prior to the release of the March 2022 sticky-price CPI less food and energy data. The time series was imported from Federal Reserve Economic Data (FRED) using the series key CORESTICKM159SFRBATL.
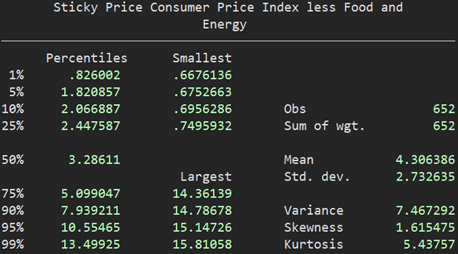
The summary statistics of the sticky-price CPI less food and energy series are:
Since many economic time series are stationary after computing the logarithm or first difference of the series, the first difference and autocorrelations of the sticky-price CPI less food and energy were plotted.


Based on the plot of the first difference of the sticky-price CPI, its autocorrelations, and partial autocorrelations, an autoregressive-integrated-moving-average (ARIMA) model was specified for sticky-price CPI. The model utilized for estimates had 3 autoregressive (lagged) terms, took the first difference of the series to model, and two moving-average terms. The model also did not include a constant in its estimation and leveraged semi robust standard errors. The code used for the model and its output is given below.
arima sticky_price_core_cpi, arima(3, 1, 2) noconstant r
In order to gauge model performance, this ARIMA model was tested using the Akaike Information Criteria against a second-order autoregressive no-constant model of sticky-price core CPI and a second-order autoregressive no-constant model of the first difference of the sticky-price core CPI. The ARIMA model was ultimately selected due to AIC statistic being the minimum of the three models compared.
The forecast of the sticky-price CPI less food and energy for March 2022 (2022m3) and its estimated standard deviation was predicted dynamically in Stata, yielding a forecast for March 2022 equal to 4.543309, with a 90% forecast interval of [4.139542, 4.947077].

The March 2022 Sticky-Price CPI less food and energy was released on April 12, 2022 (day of this publication) and had a value of 4.55181. The variance between the forecasted value and the actual value of the sticky-price CPI less food and energy using this model was 0.008501, or 0.8501%, making the forecast have an accuracy of 99.15% for March 2022. Forecasts for six-months-ahead (including March 2022) are included in the plot below.

Sources
The Rise of Startups in a Post-COVID-19 World
Sanyukta Talukdar
https://www.richmondfed.org/publications/research/econ_focus/2021/q4_feature_1
The Role of Sticky-Price Core CPI in Forecasting Inflation
Colin Spellman
https://www.richmondfed.org/publications/research/econ_focus/2021/q4_federal_reserve