In this joint blog post The Optimal Bundles takes a look at the causes, effects, and future of the U.S. - China trade war.
Editor: Zachary Shick
Authors by order of appearance: Natalie Desouza, Seth Estevis, Zachary Shick, Glenn Hubbard
In increasingly competitive basketball conferences, professional teams are looking to get an edge on analysis-based games. March 31, 2018By Peter Scharf_______It is Thursday March 30th and the opening day of the regular season for the Philadelphia Phillies and I am as least interested as I have been in years. Not because the Phillies are coming off a season where they posted one of the worst records in the league, not because most of the talent is not developed, and not because I have moved on to a win-now team. It is primarily because 1: Schoolwork in my final semester has slowly rotted away at my soul, 2: I have spent the last month or so taking my statistics skills into basketball, and 3: The Philadelphia 76ers are scorching the Earth that is the Eastern Conference. Basically, the Sixers, once the laughing stock of the NBA, have dominated and secured a playoff spot.With the Sixers advancing on analysis-based basketball and being snowed in at my Philadelphia home during Spring Break, I was inspired to build an NBA model that led to this post. To start, I will look into the game theory of basketball that the Sixers and a few other teams utilize.Maximizing Expected Shot ValueImagine a basketball court as some sort of weird matrix. Each area on the court has two components that go into the expected shot value, the worth of the shot and the percentage a shot from a certain area goes in. As a basketball player, or a coach coming up with a game plan, it would be desirable to shoot shots that maximize the expected shot value of a given situation.Up until the 1980 season in the NBA, the only way to do this was to get close to the basket. Big men dominated and much of the basketball action was closer to the rim. In 1980 things changed, the 3-point line was implemented. This made shots beyond its arc worth 0.5 times more than a standard shot.At first its usage was mainly as a gimmick.Today, teams are taking more threes than ever. As of this piece’s writing, the Houston Rockets are set to be the first team to ever take more threes than twos. The takeover of the three-point line has primarily been influenced by analytic based GMs and coaches maximizing expected shot value.Going back to the example of the basketball court matrix, the percentage of shots that go in decays the further you get away from the basket. Slam dunks, the closest shots, go in at near 100% clips. Long two’s and three’s dip under 50%. Basically, the further you get away from the basket the lower the percentage of shots that go in. This makes sense both statistically and in a “common sense” way. The further you are from the basket the harder it is for the ball to go in. Now, enter the three-point line.Although the league average on a 3-point shot is only 36%, the shot is worth 3 points and thus 3*.36=1.08 which is the expected shot value. Now imagine you are moving in towards the basket. Once you get inside 22 feet, you are no longer shooting a shot worth 3 points, however, the field goal percentage goes up.Shots from 15ft-22ft from the basket are worth two and go in 44% of the time. This leads to an expected shot value of 2*.44=.88, lower than taking a three. Moving even closer to the basket, the shot percentage goes up again. From 10ft-15ft out (approximately inside the distance from halfway to the foul line to the foul line), the field goal percentage climbs to nearly 50%.The expected shot value is approximately 1. Going on, 6ft-10ft’s expected shot value is 0.55*2=1.10, and under the basket to 6ft results in a 0.66*2= 1.32. Technically under the basket is only 0.82*2= 1.64. So, what happened here? Three-point shots are worth more than one expected point, and not until you get within the foul line are shots worth more than 1 expected point. Being that defenses make it more difficult to get to the basket, often times it is a best response to not dribble in towards the hoop, but rather step back and take a three.Across a season with 1000s of shots being taken, the law of averages sways in your favor. The dominant strategy ends up being a mixed strategy of taking shots underneath, in the in the red and blue zones, as well as beyond the three-point arc in the purple. The green and yellow are not best response shots because if you can not get the ball to the red or blue, you are better off passing it behind you and taking a three.So what does a game plan look like following this strategy? Basically, shooters are posted on the outside around the three-point line and a big man is posted up underneath the basket. The point guard brings the ball up and attempts to get the ball to the big man as shots under 10ft are worth 1.32+ and if that is unavailable, he passes to one of the shooters for an expected shot value of 1.08. Following this plan of maximizing expected shot value, the team should average over 100 points per possession. Here is what it looks like in action.This is a screenshot of the Sixer’s March 19 win over the Hornets.
 The Sixers, in blue, have all their offensive scorers located in areas that maximize expected shot value. Dario Saric, the player just beyond the arc taking the shot, Robert Covington, Saric’s left, and JJ Reddick, far corner, are all ready shooters with a high expected shot value because they are beyond the three. In this specific case, Saric, Reddick, and Covington are elite shooters and all shoot above 40% from three making their expected shot value 0.40*3=1.2. The other Sixer, Amir Johnson, is directly underneath the basket anticipating a pass or a rebound for another shot with a high expected value. The only Sixer not in a maximized space is Ben Simmons who brought the ball up to the foul line then turned around a passed it to Saric because the expected value of a foul line shot from Simmons is less than a Saric three.Philadelphia 76er’s former GM Sam Hinkie realized this as well. When selecting players in the draft or through transactions with other teams, he picked either big men or shooters. The plan was to run a maximized offense for the next 10 years. While Sam Hinkie is no longer GM of the Philadelphia 76ers, his selected shooters in Robert Covington and Dario Saric as well as big men in Joel Embiid and Richaun Holmes continue to run this analytic based offense.
 Former Sixers GM Sam Hinkie talks with a young Joel Embiid shortly after his drafting. Using Econometrics to Forecast Basketball Games (and doing well)As evident by the fact that his name gets dropped in nearly every one of my blogs, I am a huge admirer of Nate Silver. Particularly how he takes economics and statistics and applies them to areas typically outside the field. In the area of sports, Nate Silver has shifted forecasting away from betting lines and ESPN “analysts” and more towards a quantitative and probabilistic approach. I figured if Nate Silver can do it, I can get close.Basketball seemed like the easiest sport to start forecasting. Looking at the top records in the league shows that the best teams generally win 70%-80% of their games. Compare this to a sport like baseball where teams are more even and the best team only wins 63% of their games. So essentially, basketball has more skill involved and less randomness, more signal to capture and less noise.At my aid are my new-found skills in R and enrollment in ECON483 Economic Forecasting (I highly recommend taking this course). I spent the first few days of my Spring Break gathering data and crunching numbers. Looking for patterns between wins, points and general basketball statistics. I began to diverge into two types of basketball forecasting, macroforecasting and microforecasting. Macroforecasting pertains to season long play. How many wins will the team have? Where will they place in their conference? Which team will score the most points this season? Macroforecasting does this very well.
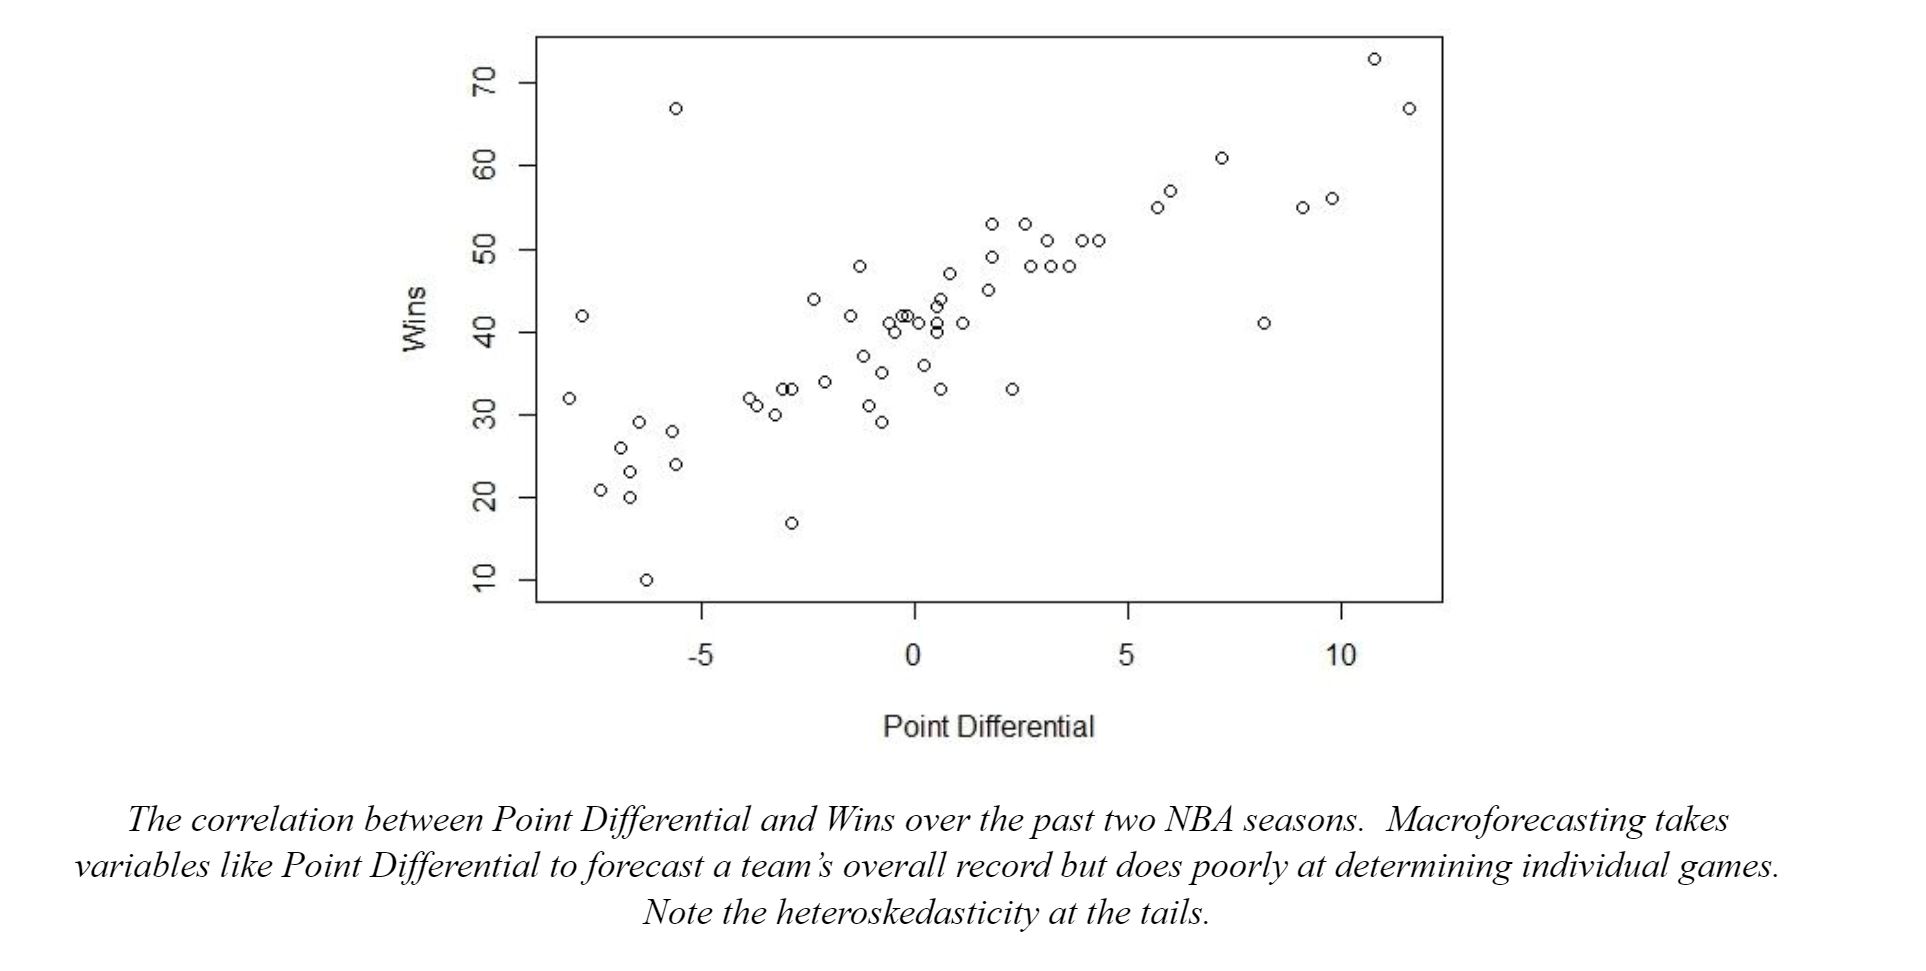 For individual games, the macroforecasting approach was not effective. I realized this when I was explaining my research to a friend and he responded “Who cares?, I just want to know who wins tonight!” .For game-by-game forecasting I needed to explore the microforecasting approach. This approach looks at the scoring and defense of the two teams in a game and determines in outcome, this approach ends up being much more difficult.To model an individual game, be careful about what stats you use. Player stats are often measured in three different ways: per game, per 100 possessions, and per 36 minutes. It is important to focus on per game stats. Per possession and per minute stats are better on player specific statistics but on a whole team they are a poor measure. Remember, every team only control the pace when they are on offense. Stats like offensive efficiency and defensive efficiency can be skewed by fast or slow offenses in an actual game format.My microforecasting model continues to be refined but it looks something like this:The result of the game is Yv - Yh where Y is the predicted points for each team. If this number is positive, the visitor wins. If it is negative it is a home victory. Y is composed of:
 Where y is the predicted points, Ha is a dummy (binary) variable that is activate for the home team because across 2056 games a clear home field advantage was observed, B is an adjusted average of points scored per game, Dj is the defense added points of the opposition (good defenses this number is negative because they take away and bad defenses have this as a positive number. This number can also be influenced by how fast the opposing team’s offense runs.), and E is an error term. Numbers get rounded down to whole numbers because you cannot score half points in basketball. My actual running model is of course more complicated than this, but this equation accounts for most of it.As an example, let's use the Friday March 30th, 2018 7:30PM game with the Philadelphia 76ers facing off against the Atlanta Hawks. The Sixers forecasted score is:
 For the Hawks it is:
 Thus, the forecasted result is:
 The model forecasts a Sixers, the visiting team, victory by plus 8. The actual game was much lower scoring than anticipated, particularly because the Sixers played their worst players in the 4th quarter to rest the starters for the playoffs, and the final score was 101-91. The Sixers won by 10 and the residual between the forecast and the actual score is -2. Although not perfect, sports are volatile and getting this close is impressive.To run this regression in programs like STATA and R, treat opposing defenses like seasonality. This will treat the opposing defenses like dummy variables and apply them when the team name is equal to a certain character value. To visualize the effect of opponent defense on score look at the plot below. It is the 76ers scores for each game plotted twice, to the left of the black line for unadjusted and to the right for adjusted. The red dashed lines are at 119 and 99 (within one standard deviation) and the green line is the Sixer’s B of 109. Although slightly, the right side of the black line is more correlated around the mean.
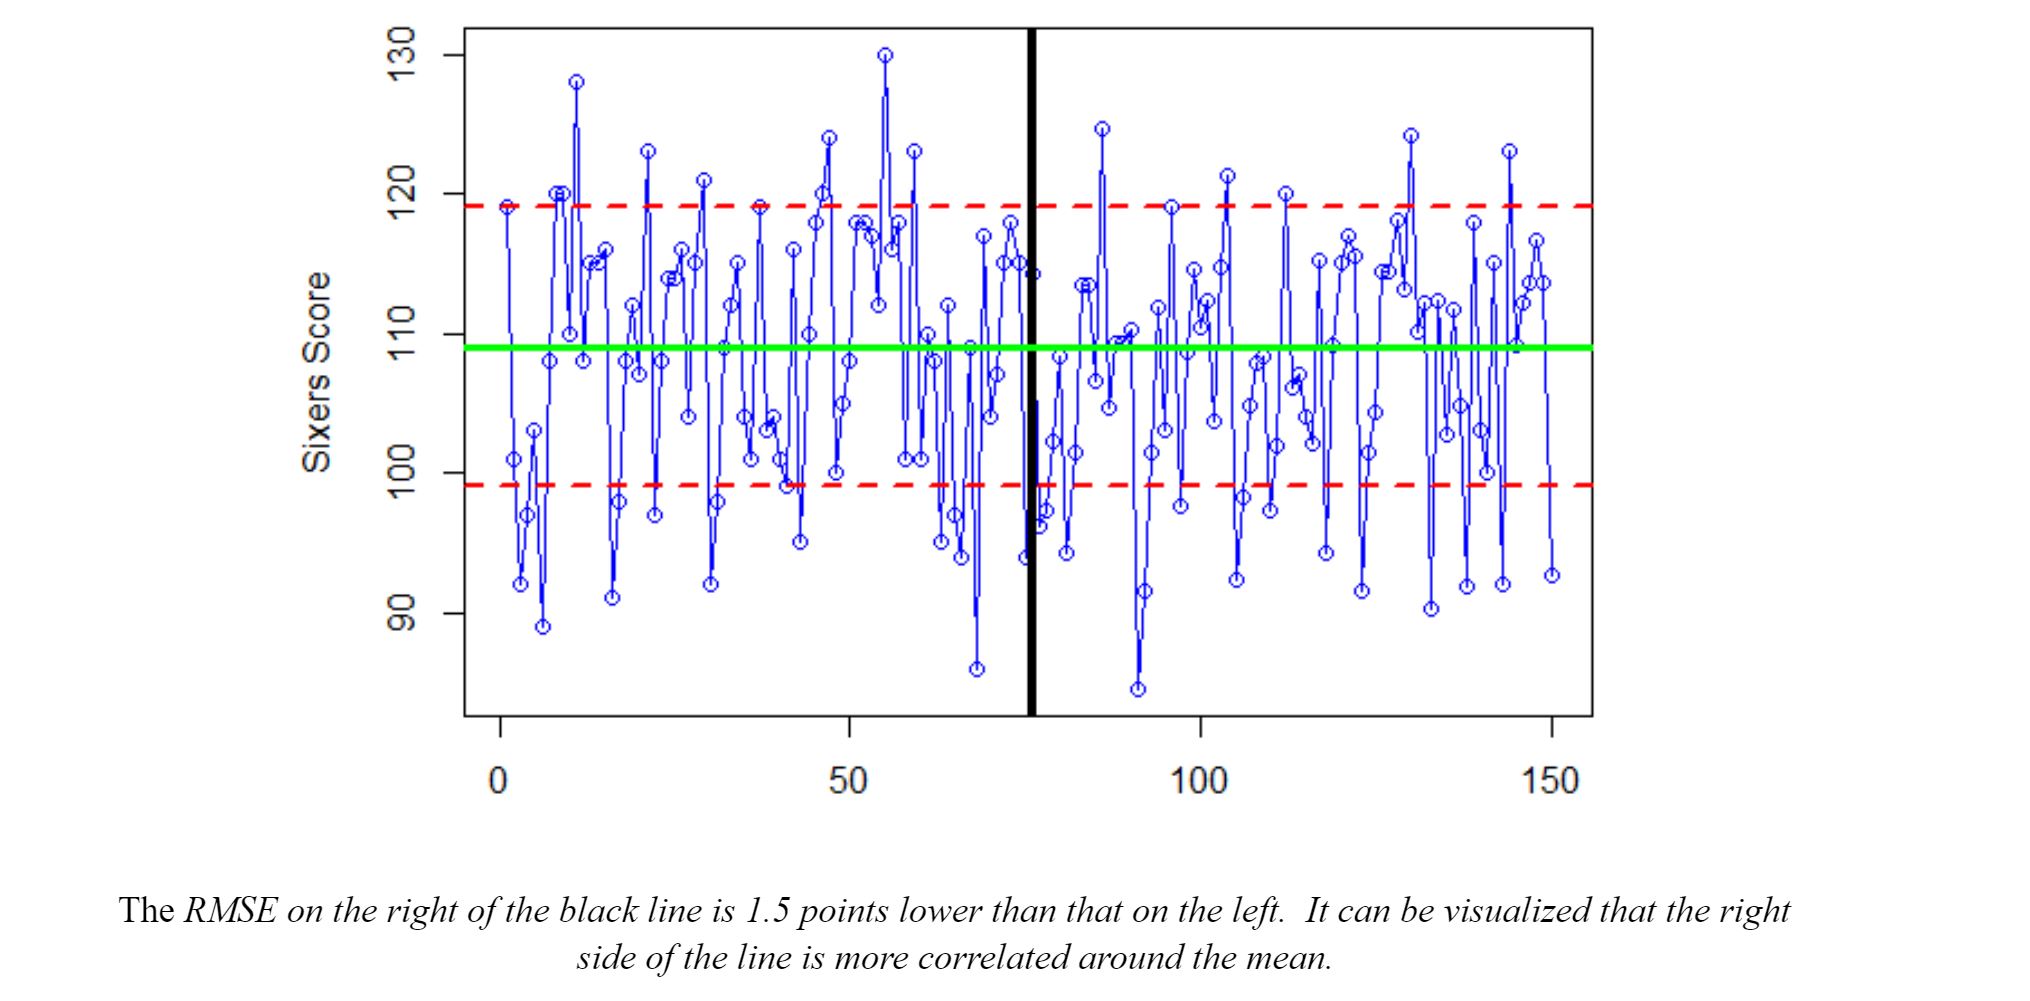 As a sports fan, using the stat and game theory skills I picked up in the classroom through the B.S. in Economics allows me to get involved with the game. I have become a more informed fan, despite only watching half of my home team’s games. I encourage anyone to apply statistics to an interest of theirs, it is surprisingly fun and gives new insights into that field._______ Author's Note: All statistical data comes from basketballreference.com All analysis and graphing was done using R within Rstudio or Microsoft Excel. For more information contact optimalbundle.psuea@psu.edu. Editor's Note: Minor changes have been made to the original version of this piece. Feature Image Credit: Public Domain
A lucrative but geographically challenging market is the battleground for some of the Commonwealth's largest health networks. March 7, 2018By Nicolas Guerrero_____
In the years following the implementation of the Affordable Care Act, its provisions and resulting cost increases led to a series of reconfigurations in healthcare markets across the country. Pennsylvania is a market where healthcare providers and insurers have found a particular need for steadfast consolidation.
Three entities dominate a geographically challenging, yet lucrative healthcare market. The University of Pittsburgh Medical Center (UPMC) is the largest non-governmental employer in Pennsylvania. Headquartered in downtown Pittsburgh, UPMC operates over thirty hospitals in the western and central regions of the state. In addition, UPMC Insurance Services covers over 3.4 million members.
Penn State Health operates the flagship Milton S. Hershey Medical Center, Children’s Hospital and Cancer institute in Hershey, the Penn State Health St. Joseph Hospital in Reading, and 120 medical offices across the Commonwealth. Generating between $1.3 and $1.5 billion in annual revenue, Penn State Health is a major health system and its flagship hospital is the largest in the Greater Harrisburg region.
The University of Pennsylvania Health System, Penn Medicine is the state’s second most lucrative network after UPMC generating around $5.3 billion in annual revenue and operates six hospitals and eight multispecialty facilities along the eastern flank of the state.

The urban markets of Philadelphia and Pittsburgh are separated by 300 miles of vast, sparsely populated rural countryside where medical facilities are likely operated by a dominant regional health system.
In March 2015, the Penn State Milton S. Hershey Medical Center completed plans to merge with PinnacleHealth System, the other dominant healthcare provider in the Harrisburg area. Together, both entities would operate as a single network providing health services for Dauphin County and surrounding markets. In December of that year, The Federal Trade Commission (FTC) filed a lawsuit halting any further action and requesting further information. The FTC, along with the Pennsylvania Office of the Attorney General argued that such merger would create a regional monopoly, increasing prices and potentially lowering quality for the South-Central Pennsylvania market. Yet markets are ambiguous and difficult to make out with naked perceptions.
This particular point was made by the United States District Court, which argued that the FTC had failed to define which specific markets would be harmed by the merger. For horizontal mergers, such as the one between Penn State Hershey and PinnacleHealth—where both merging entities are within the same or similar industry—federal anti-trust authorities apply the hypothetical monopolist test to clearly define such market. In this test, the relevant geographic market is the smallest area in which a single firm could raise prices without consumers resorting to firms outside the region to avoid such a price increase.

The Harvard Law Review notes that District Court found that the FTC had not adequately defined the relevant market as the four-county area around Harrisburg, and “that 43.5% of Penn State Hershey’s patients travel to the hospital from outside of the region, suggesting that the FTC’s proposed market failed to properly account for where the hospitals draw their business”. When the Third Circuit Court of Appeals reversed the District Court’s decision, Penn State spent $17 million on legal arguments in an unsuccessful attempt to push for the merger. The motivation behind the Penn State Hershey-PinnacleHealth merger focused on the benefits by scale economies in a market perceived as underserved by University officials and Pinnacle executives. The 64% market share that both entities would have represented in the region was to be transitory, as equally large health “megasystems” such UPMC and Penn Medicine were quickly expanding into the central Pennsylvania market.
Penn State Hershey CEO Craig Hillemeier argues that with Penn State Hershey operating at near full capacity, the merger would have given the medical campus the size and efficiencies required to compete with entering firms without sacrificing patient care. According to both entities, merging the firms would have led to decreased operating costs, increased flexibility in transferring patients to other hospital locations, lower construction costs, and lower costs for patients on a case-by-case basis. The Penn State University Board Trustees dropped all litigation efforts the following year. The projected legal costs coming out of University coffers outweighed the benefits of completing what seemed to be a lengthy merger process.
 PinnacleHealth already searching for capital, immediately shifted its focus to its next potential partner. In 2017 PinnacleHealth successfully merged with UPMC, further consolidating Pennsylvania’s largest health system. As predicted, the newly created UPMCPinnalce expanded quickly, operating 12 hospitals in ten counties across central Pennsylvania.
Expanding in this region is cost-effective for a behemoth like UPMC, where operating costs for existing hospitals and construction costs for new ones are relatively low. Some of these regional hospitals have between ten and sixty beds and serve markets that no other healthcare provider would likely find economic sense in entering.
Lancaster General Health was acquired by Penn Medicine in 2015. This westward encroachment by a Philadelphia-based firm alerted UPMC and Penn State Health, as the fragile central Pennsylvania market has relatively fixed demand. This contributed to Penn State’s increased “megasystems” competition argument during federal litigation. Should Penn Medicine seek to expand beyond Greater Philadelphia, it will add more pressure to competing health systems, and find several health networks already setting their eyes on the lucrative region. That is what UPMC discovered and successfully tackled when it expanded eastward of Pittsburgh. Penn Medicine has the financial resources and acclaimed reputation to be just as successful.

With health systems quickly growing across the Commonwealth, Penn State Health sought to find a partner that would be reputable and profitable in the face of aggressive competition. After the failed attempt to merge with PinnacleHealth, university resources had to be used carefully, objectives had to be clear, and litigation avoided if possible. Without being neither a merger nor acquisition, Penn State Health partnered with Highmark, the largest insurance provider in the state.
Under this agreement, Highmark ends its partnership with UPMC, and gives an infusion of capital to Penn State Health, allowing it to build new hospitals and facilities to directly compete for UPMC’s consumers. $1 billion will be used to update and expand Penn State Health operations. In exchange, Highmark will send its members to the Penn State Health system hospitals and physicians. The insurer now has three seats on Penn State Health’s fifteen-person board. Thus, Highmark becomes a healthcare insurer and provider through this partnership, just like UPMC.
___________ Featured Image: The Susquehanna River flows through central Pennsylvania Image Credit: Pubic Domain
The Chicago-based volatility index attempts to give investors a tool to calculate impending fluctuations in the market.February 16, 2018By Patrick Reilly_______The CBOE Volatility Index, known by its ticker symbol, VIX is a tool that investors use to estimate fear in the marketplace. The VIX was created in 1993 through the Chicago Board of Trade and was the first way to measure volatility in the stock market.One way to think about it is that the VIX is like buying insurance. If you live in Florida and you hear that a hurricane is coming you’ll be willing to pay much more for insurance because there’s a higher chance that you’ll need insurance. You will pay more than you would normally.It’s very similar for investors if they’re afraid of a stock market crash, they’ll be willing to pay more for the VIX. The price level of the VIX is calculated using the price of put options on index funds. That sounds complicated but put options are just bets that the price of the stock market will go down. So if people think that a stock market crash is coming the price of the VIX will go up very quickly. Investing in the VIX implies that you’re anxious about the economy in the near future. However, over the last couple years, before this month, there wasn’t much to be anxious about. 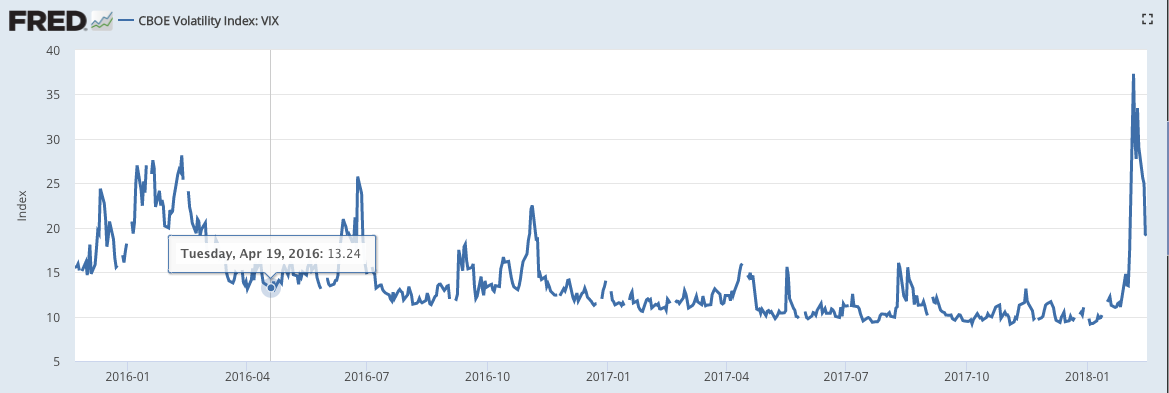 The value of the VIX was steady at historically low levels of around 10 for several years. This led to the creation of the XIV, the inverse of the volatility index. Every time the value of the volatility index VIX increased, the price of XIV would decrease and vice versa. Investing in the XIV means that you were willing to bet that there wouldn’t be any hurricanes in the near future and that low volatility would continue. So over the last several years this was a good bet with steady income as the VIX fell consistently the price of the XIV increased consistently, until this month.
 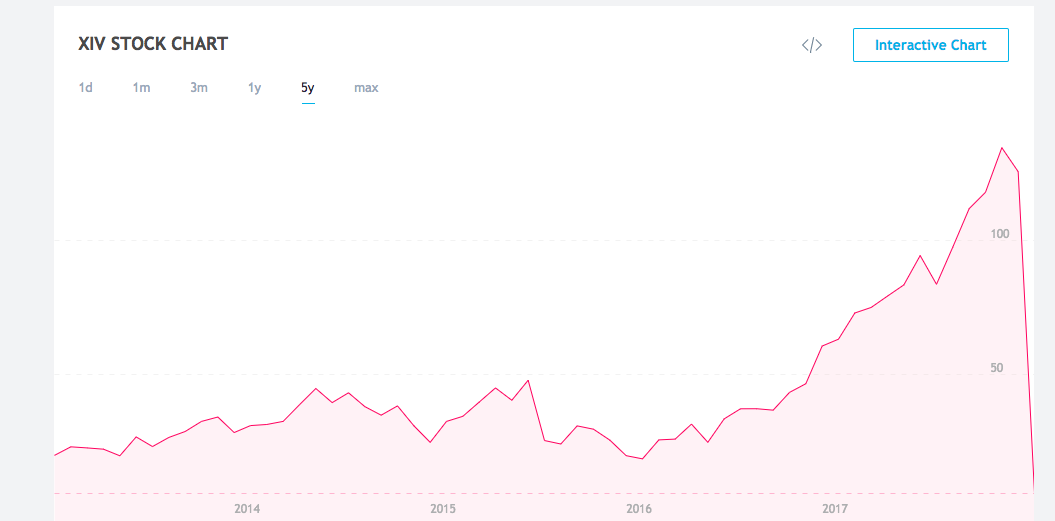 Over the last year the price of the XIV was rising fast to a level over 100 until it crashed. In about two weeks the XIV lost 100% of it’s value and is no longer available for purchase.At the same time the price of the VIX rose to levels not seen since the 2008 financial crisis.Hopefully that all made sense but there’s one more wrench that was thrown into the equation. A whistleblower told regulators that there was a scheme to manipulate the VIX. Let’s say that you are a weatherman in Florida and own flood insurance and want to sell that flood insurance to someone else. You could go on TV and lie and say there are 10 category five hurricanes on their way and the value of your flood insurance would increase and you could sell at a profit.Similarly, if you could raise the price of the put options that the volatility index is priced off of then you would know that the price of the VIX will rise and the price of the XIV will fall. You could do this by raising fears of an impending stock market collapse or just buy the put options yourself and increase the demand and price. If you know the future prices of the VIX and XIV you could make a lot of money quite easily. The Chicago-based exchange denied the accusations but it does make sense to me at least in theory if you have enough money. The accusations are interesting and if proven would be a pretty brilliant money making scheme although illegal. On the other hand the price of the VIX could have just risen because there was a stock market correction happening. It’ll be interesting to see in the near future if there are any truth behind the allegations.___________Photo Credit: Modern Farmer Featured Image: The trading floor of the Chicago Board of Trade
As online retail giant Amazon narrows its quest to find a location for its second headquarters, local governments across North America are testing the limits of economic incentives.February 2, 2018By Avery Ryan_______Within the past few months, The race to host Amazon’s headquarters has intensified and is now boiled down to a list of twenty cities still in the running. Earlier in January, Amazon released a list of finalists, which identified the 20 out of the 238 bids from across North America that were still being considered for hosting the new headquarters. These finalists are Philadelphia, Boston, Toronto, Atlanta, New York, Washington, Miami, among others. The reason behind the fierce competition lies in the opportunities that hosting operations for a company such as Amazon would bring for a city and surrounding metro area.Being the location of Amazon's headquarters bring a long list of benefits. As many as 50,000 new jobs would be created. The winning city would receive great publicity as well. Overall, acquiring Amazon’s headquarters is most American mayor’s dream come true.However, the race has turned quite serious in the past few weeks. Cities are going to extremes in order to get Amazon’s pick, and it may be doing more harm than good. Cities have offered billions of dollars in tax subsidies in order to attract the firm. Amazon CEO, Jeff Bezos, is operating this deal with a degree of secrecy, making it harder for city leaders to figure out how to best win over the $675 billion company. For example, New Jersey has offered $7 billion in tax-breaks for Amazon if it chooses Newark for the new headquarters. While Amazon's entry will bring more revenue and jobs, the city will have to take other risks into consideration. They must consider widening roads, hiring more teachers, and building more housing. The cost of all of these upgrades, according to the Washington Post, is going to fall on residents and small business owners of the city. Residents who will have to pay more in a state with already high tax levels may not be as willing to jump on board. Small and mid-size businesses will have to play a role in the repayment of these tax subsidies. Smaller firms, with Amazon being an unrivaled behemoth, will not be pleased that their tax dollars will be supporting their competition.An interesting deal may arise in the greater Washington, D.C. area, where 3 of the finalist cities are located. Muriel Bowser, the mayor of Washington, D.C. made a statement regarding how the headquarters of a company of such size would equally benefit her city, Northern Virginia, or Montgomery County, Maryland. Economists, along with public policy experts, agree that these three finalist cities should collaborate in order to convince Amazon to come to any of the three cities.PrecedentsThis race for a facility to be placed in a city in order to gain revenue and improve standard of living is nothing new. Sports franchises cause the same kind of competition between cities due to the enormous amount of revenue generated in this business. Cities will fight to acquire sports franchises, and sometimes are forced to spend large sums of money just to keep them in the city. Similarly to the Amazon situation, economists question whether or not this decision by city leaders is more helpful or harmful.Brad. R. Humphreys, an economics professor at West Virginia University , researches the economics of professional sports. In a piece for the Regional Science and Urban Economics Journal, Humphreys wrote about a change in viewpoint about the benefits of tax subsidies for the purpose of sports franchises. Between 1950 and 2010, an estimated $59 billion in 2006 dollars were spent on the building of sports facilities in the United States. Humphreys notes that the business done inside these stadiums is entirely private enterprise and the revenues generated from private sporting events are split between the employees, players, and owners. There are not many other private profit-generating firms that receive such large amounts of tax subsidies. Humphreys suggests that while it has been said that these facilities increase jobs, create higher incomes, and increase tax revenues in the past, that may not be the case anymore.Proponents of sports facilities are now justifying the subsidies with urban redevelopment. The bulk of this journal analyzes a spatial model that suggests that cities are giving out subsidies to these sports franchises despite the lack of evidence that the construction of these sports facilities create fiscal benefits for a local economy.The similarities between sports franchises and Amazon’s headquarters bring up an interesting question for cities that are still in the running for Jeff Bezos’ competition. Providing such large subsidies may be guiding cities in the wrong direction. However, the race is still on and the cities are still pushing. Whichever city finishes in first place will be the new home of Amazon’s second headquarters, and will experience the externalities--both positive and negative--of experimenting with incentives of such magnitude.________ Featured Image: Central Toronto. Toronto is the only city outside of the U.S. to be considered by Amazon to host its new headquarters. Photo Credit: Michael Muraz Referenceshttps://www.washingtonpost.com/business/economy/for-finalists-in-the-amazon-headquarters-sweepstakes-the-fun-has-turned-serious/2018/01/26/b517a196-0179-11e8-bb03-722769454f82_story.html?utm_term=.f7e48414fe34Humphreys, Brad R., and Li Zhou. “Sports Facilities, Agglomeration, and Public Subsidies.” Regional Science and Urban Economics, vol. 54, 2015, pp. 60–73., doi:10.1016/j.regsciurbeco.2015.07.004.
New tax legislation poses challenges for some Americans, but enthuses and incentivizes productivity for others. January 19, 2018
Patrick Reilly, Nazmus Mallick, Avery Ryan, and Peter Scharf
________
The newly passed tax bill, officially legislated as H.R. 1 or Act to Provide for Reconciliation Pursuant to Titles II and V of the Concurrent Resolution on the Budget for Fiscal Year 2018, was signed into law by President Donald Trump on December 22, 2017. It passed through the House of Representatives and the Senate along party lines. According to the bipartisan Committee for a Responsible Federal Budget, H.R. 1 includes the eighth largest tax cut since 1918 and the fourth largest since 1949 when adjusted for inflation. It is American firms that are projected to reap most benefits from the new tax bill. For example, Warren Buffett’s Berkshire Hathaway is expected to have a twelve percent increase in profits resulting in a $37 billion gain. In the short-run, both corporations and employees will see benefits resulting from the tax reform, but more time is required in order to see other, more complex effects such as a likely increase in the national deficit. A report released by KPMG immediately following the enactment estimates that the law provides an overall tax reduction of $1.456 trillion over the next decade when not accounting for the fluctuations of the business cycle. One of the provisions within the new law includes the permanent repeal of health care subsidies and the mandate that requires all individuals over the age of twenty-six to join a health insurance system, both which were part of the Affordable Care Act, the Obama Administration’s flagship piece of legislation. Repealing the individual mandate is estimated to reduce the federal deficit by $338 billion within a period of eleven years, but result in 13 million Americans not obtaining health insurance while premiums are projected to increase by ten percent.
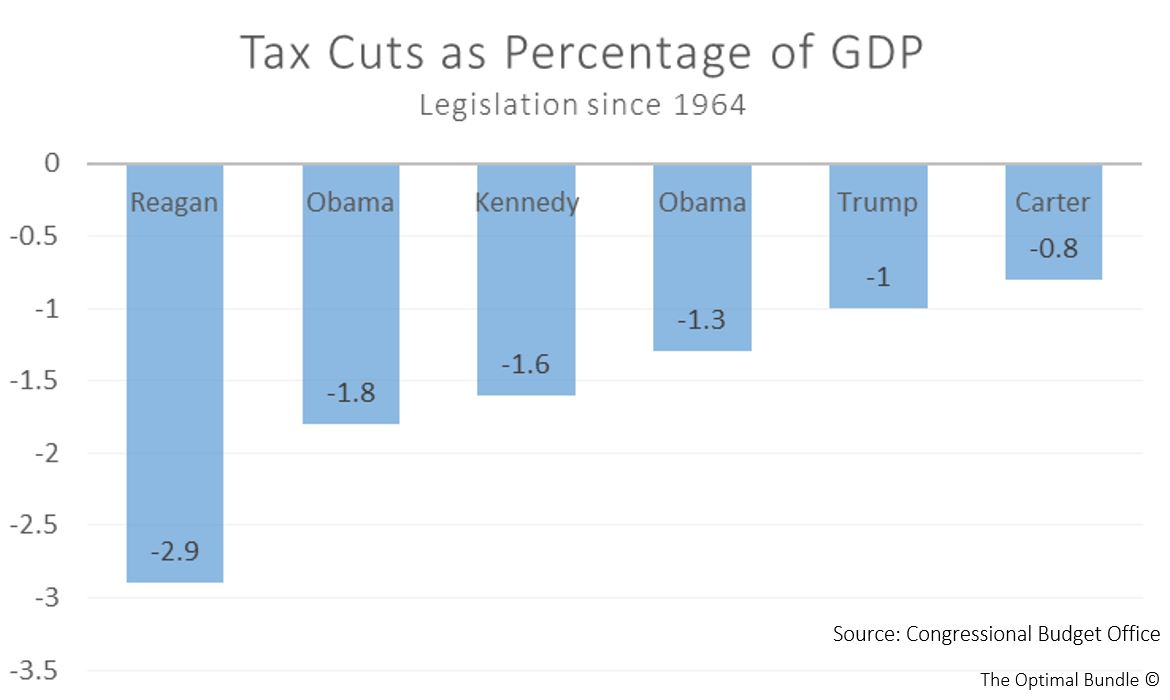
According to estimates by Harvard economist Robert Barro, cutting the average marginal tax rate for individuals by 1% will increase GDP by 0.5% over the next two years. In other words, a cut in tax rate will increase the amount of disposable income available to the citizens thus increasing their purchasing power. This will tend to have an expansionary effect on the economy as consumer spending and investment is likely to increase.
Such change in fiscal policy affects several sectors of the American economy. One effect that has been analyzed so far is how the corporate tax cuts within H.R. 1 is affecting activity in capital markets. Currently, the stock market is thriving and many, including the president himself, believe that such growth is catalyzed by the recent tax overhaul.
“Just a few weeks after major tax reform legislation was approved by Congress and signed by President Trump, we are seeing the broad benefits of economic growth...The Dow has climbed to a new all-time record, over 26,000 in the past few days. That reflects $7.2 trillion in new wealth added to the economy over the first year of the Trump presidency, broadly shared by everyone with stock ownership, either directly, or through pension plans and retirement savings.”Lewis K. UhlerFounder, National Tax Limitation Committee
In a January 11 interview with the Wall Street Journal, President Trump told a reporter that, “The tax bill has turned out to be far greater than we ever anticipated… It’s selling itself.” The President's confidence is not left unsupported. Trend Macrolytics LLC Chief Investment Officer Donald Luskin stated that since the passing of the tax bill, Wall Street Journal analysts have increased their projections for earnings in the S&P 500 by an unprecedented 4.6%. Due to the corporate tax cut from 35% to 21%, a confidence boost in the stock market has led to its noticeable growth. Warren Buffet voiced his opinion regarding the tax cut to CNBC, “You had this major change in the silent stockholder in American business who has been content with 35 percent ... and now instead of getting 35 percent interest in the earnings they get a 21 percent and that makes the remaining stock more valuable." While there are pundits and analysts issuing warnings about an impending stock market crash, it is important to remember that markets are dependent on consumer confidence. Bullish activity reveals that at a minimum, investors are confident about the future of the economy under the Trump presidency. In the days following the passage, corporations like Wells Fargo, Bank of America, and J.P. Morgan announced cash bonuses for thousands of their employees, partly due to reinvigorated incentives. The drive for investing means that people are betting on economic success, increased real wages, and higher business profits. All of the effects that the tax cut has had on the stock market seem to be positive due to growth. However, it is important to keep in mind that while this growth enthuses C-suite executives, polls reveal that it does not do the same for a significant portion of the public. The middle class and lower income earners will see mixed results. The Institute on Taxation and Economic Policy analyzed the H.R. 1 to see how tax cuts and hikes were distributed across income percentiles and across time as provisions within the bill change the tax rates by year. These figures also factored in the elimination of the penalty on the healthcare mandate, which is a small tax cut in itself for the lower income earners. The middle 20% of income earners will see a reduction in taxes of about 1.5% in the first years of the bill and that will slowly decrease over time with the 2027 estimate being a net zero change in taxes. The lower middle class, the bottom 20%-40% of income earners, will benefit similarly in 2018 with an expected reduction of 1.3% in taxes that will shrink to a net .5% increase in taxes by 2027. The 60%-80% of income earners will do slightly better with a reduction of 1.6% on their federal taxes to start and a net neutral tax effect by the bills end. By far the winners of this tax bill were the top 10% of income earners who will see reductions of close to 5% on their tax bills and will see slightly smaller decreases through time.The Tax Foundation’s analysis centered on the benefits to hypothetical households involved during the bills early stages in the late 2010s and found that every income level will benefit from the new tax bill. The lower marginal tax rates coupled with a larger standard deduction were the primary reasons for lower taxes among the middle and lower class groups. A larger and more accessible child tax credit is a potential benefit for families in the middle of the income distribution. These calculations were made without factoring in the effect of the individual healthcare mandate and ignore the changing nature of the bill over time.One unlikely entity that will be negatively affected by the new tax bill is Penn State Football. Previously, alumni and other boosters could write off the cost of season tickets and luxury boxes as tax-deductible charitable contributions. According to the newly revised tax code, buying the best seats for a Penn State football game is not considered a charitable donation and is not included in the new law. At the University of Georgia the right to buy luxury box seats can cost $60,000 a year, which was tax deductible. It is now likely that demand for luxury boxes could fall.___________Nicolas Guerrero contributed to this essay. Featured Image:Ben Aronson (1958-present) AmericanSunset, Chicago River (2014) Oil on Panel BibliographyThe First Trump-GOP Tax Bill: National and 50-State Analysis. Institute on Taxation and Economic Policy. December 2017. https://itep.org/wp-content/uploads/Trump-GOP-Final-Bill-Report.pdfLorin, Janet; Novin-Williams Eben. College Football Teams Mount Blitz to Lock In Donors' Tax Breaks. BloombergPursuits. December 22, 2017. https://www.bloomberg.com/news/articles/2017-12-22/college-football-teams-mount-blitz-to-lock-in-donors-tax-breaksShell, Adams. List of companies that paid bonuses or boosted pay since tax bill passed. USA Today. January 11, 2018. https://www.usatoday.com/story/money/2018/01/11/list-companies-paid-bonuses-boosted-pay-since-tax-bill-passed/1023848001/Buhayar, Noah. Berkshire to Reap Estimated $37 Billion Bump From U.S. Tax Cut. Bloomberg LP. January 8, 2018. https://www.bloomberg.com/news/articles/2018-01-08/berkshire-to-reap-estimated-37-billion-bump-from-u-s-tax-cutEl-Sibaie, Amir. Who Gets a Tax Cut Under the Tax Cuts and Jobs Act? Tax Foundation. December 19, 2017. https://taxfoundation.org/final-tax-cuts-and-jobs-act-taxpayer-impacts/Rep. Brady, Kevin. (R-TX) [Sponsor]. United States House of Representatives - 115th Congress (2017-2018). United States House of Representatives Ways and Means Committee. H.R.1 - An Act to provide for reconciliation pursuant to titles II and V of the concurrent resolution on the budget for fiscal year 2018. Public Law No: 115-97. December 22, 2017. https://www.congress.gov/bill/115th-congress/house-bill/1New Tax Law (HR1) Initial Observations. Klynveld Peat Marwick Goerdeler [KPMG] December 22, 2017. https://home.kpmg.com/content/dam/kpmg/us/pdf/2017/12/tnf-new-tax-law-dec22-2017.pdfTranscript of donald trump interview with the wall street journal. (2018, Jan 14). Wall Street Journal (Online) Retrieved from http://ezaccess.libraries.psu.edu/login?url=https://search-proquest-com.ezaccess.libraries.psu.edu/docview/1987216534?accountid=13158Luskin, D. L. (2018, Jan 12). Tax reform has released the bulls. Wall Street Journal Retrieved from http://ezaccess.libraries.psu.edu/login?url=https://search-proquest-com.ezaccess.libraries.psu.edu/docview/1986575861?accountid=13158Kim, Tae. Warren Buffett says 'huge' corporate tax cut is 'not baked in' stock market. CNBC. January 10, 2018. https://www.cnbc.com/2018/01/10/warren-buffett-says-huge-corporate-tax-cut-is-not-baked-in-stock-market.htmlHarper, Jennifer. Desperate Trump critics rage against the stock market boom. The Washington Times. January 18, 2018. https://www.washingtontimes.com/news/2018/jan/18/though-the-economy-appears-to-be-humming-and-happy/
America's favorite pastime undergoes a fusion with the dismal scienceOctober 27, 2017By Peter Scharf
I am a huge baseball fan. I have been watching the MLB-particularly my hometown Philadelphia Phillies-regularly since I was 8 years old. I have attended 50-75 games and watched my boys in red pinstripes play in the National League Division Series, National League Championship Series, and ultimately the World Series. My passion for baseball has not waned since I stopped playing in high school, and, if anything, has increased. My perspective on the game has changed significantly though. Through the coursework of an economics degree, I have gained the skills to not only observe baseball as an outsider, but take my own approach and analyze every player, every game, and every offseason signing. Taking the ideas of economics and combining them with baseball fandom is nothing new, however. Economics has had a grip on baseball since even before my Little League Days.
Economics complements baseball due to the statistics driven nature of the academic field. Baseball is arguably the most stat-driven sport. Baseball executives have begun using similar techniques that a professional economist or business analyst would use and apply them to baseball player acquisition. Game theory has also very recently begun to creep into the world of baseball. While a simplified version of game theory has been in use since the 1800s, today batting coaches and hired analysts are determining to try to compute a pitcher’s move and the batter’s response.
Throughout this piece, I will assume that you have some basic knowledge of the game of baseball. I, however, do not assume you know the full glossary of baseball statistics. Thus, I include the official list of MLB statistics.
A Brief History of Baseball Analytics
Baseball statistics have been around since the 1850’s1 when avid baseball fans could find a player’s batting average, walks, home runs, doubles, triples, and singles through simple arithmetic and analysis of a game’s complete box score. Little changed in the baseball world throughout the next century. While baseball executives certainly used these simple statistics to gauge a potential trade acquisition or draft pick, it was the subjective opinion of a scout who had the most weight.
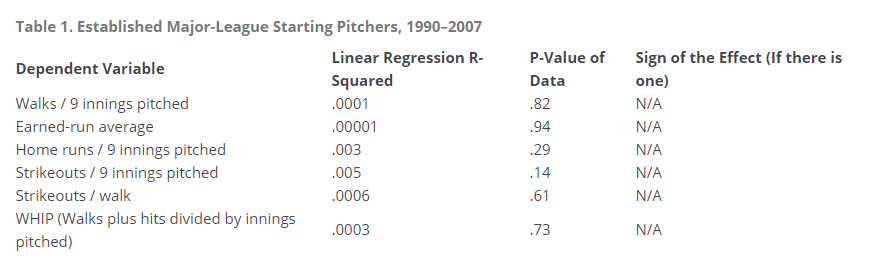
While scouts insist on drafting taller pitchers. No statistically significant correlation can be found between height (as a function of inches) and pitcher effectiveness.16
Modern baseball statistics, or sabermetrics, began in the 1980s when Bill James, an avid baseball fan and writer, began to publish The Baseball Analyst2. Bill James and other baseball statisticians, known as sabermetricians, were trying to solve issues with traditional measurements. For example, batting average was a great way to find how often a hitter reached base. However, it did not account whether that hit was a single, double, or home run. Thus, slugging percentage (SLG) was created. This new statistic accounted for both, how often a player hits and what base he reached on the hit. Sabermetricians also realized that batting average and slugging percentage did not account for other ways that a player could reach base. On-base-percentage (OBP) was created to factor in walks, hit by pitches, and hits into an average. To determine the general character of a hitter they combined on base percentage and slugging (literally OBP+SLG) to create OPS. OPS is now considered the most accurate statistical representation of a hitter.
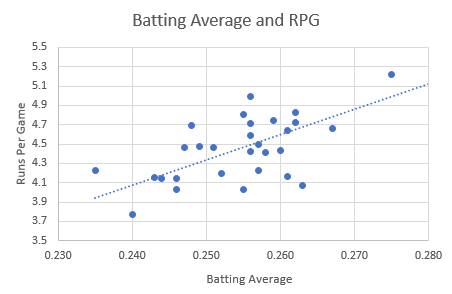
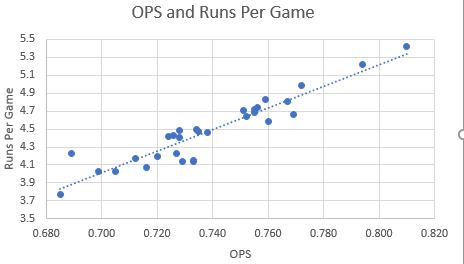 The correlation of Team Batting Average and Runs per Game vs. Team OPS and Runs per Game. Data from the 30 MLB clubs for the 2016 season.
Another advancement on the typical batting average has been the batting average on balls in play or BABIP. Batting average on balls in play considers a player’s chances of getting a hit after they hit the ball into fair territory. Pull hitters and power hitters who play into shifts often have very low BABIP. Contact and slap hitters find holes and get on base more often.
The sabermetric analysis does not end with the offensive side of the game. Sabermetrics have also expanded upon pitching and fielding. For example, rather looking at ERA which may be influenced by the fielding or perhaps lucky hits against a shift. Baseball analytics experts came up with pitcher exclusive statistics like SO/9 which effectively measures a pitcher’s strikeout rate per nine innings or DICE which only considers instances where the fielders never touch the ball like home runs, walks, strikeouts, and hit-by-pitches.
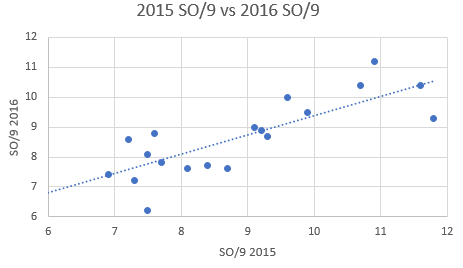
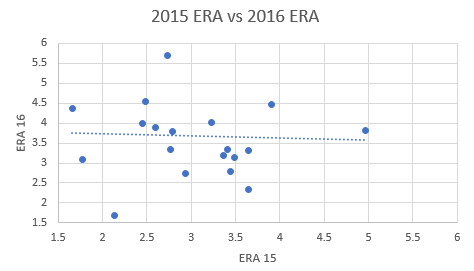 The comparison of ERA and SO/9 among 20 pitchers with more than 300 innings pitched between 2015 and 2016. Note that the ERA of the previous year has no impact on the ERA of the current. The Sabermetric statistic SO/9 has a near 1/1 relationship.
New fielding statistics like range factor have replaced the traditional fielding percentage. Fielding Percentage merely takes the percentage of the times a player fields a ball cleanly and fields it without error. Range factor takes into effect a player’s ability to cover the field. For a hypothetical example, say you have a slow outfielder who rarely gets to make a play on a ball because he is so slow. His fielding percentage may be very high (you cannot make an error if you never make it to the ball) but his range factor would give a better description of the fielder he is. To properly evaluate range factor one must take into account the position a player is fielding from. For example, a shortstop sees much more action than a first baseman.
From the ground of all these newer baseball statistics grew WAR or wins above replacement. Among sabermetricians today, WAR is the final and most accurate measure of how “good” a baseball player is. WAR is an attempt to determine how valuable a certain player is to the team. Essentially, it compares a given player to a hypothetical “replacement” who is league average in every statistic. WAR has no standard way to be calculated, rather each individual baseball statistics website calculates its own version. Rather than spend the next 10 pages discussing the ways WAR can be calculated if you are interested check out Baseball Reference and Fangraphs descriptions of WAR.
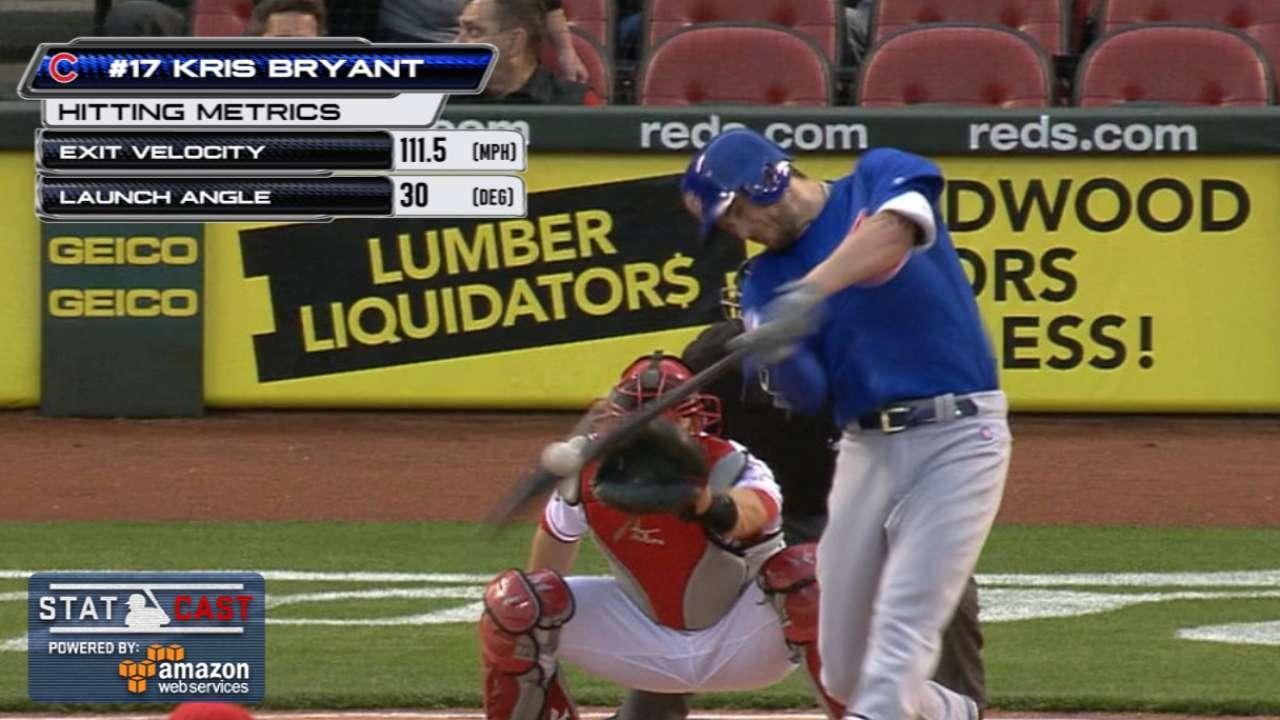
Through technological advances of the recent years, physics-based sabermetrics have begun to dominate the sport. The two most talked about are exit velocity and launch angle. Exit velocity is the speed, generally in mph, that a ball leaves the bat. Launch angle is the angle by which the ball is hit from the plate. Low launch angles result in ground balls and infield outs. High launch angles result in pop-ups. Good hits are described at having launch angles 25-35 degrees.
 Sabermetrics and How the Economists Took Over the Front OfficeSabermetrics first reached the front office of an organization with Billy Beane and the Oakland Athletics. This account is made famous because of the book and movie Moneyball3. To summarize the Oakland Athletics have some of the lowest payroll in the league. To remain competitive, GM Billy Beane, stuck to a strict sabermetric approach to try to find undervalued players that they would not have to pay as much for. Since the release of the book and movie, as well as the spread of Beane’s management tree around the league, sabermetric analysis has been taken over Major League Baseball. As a result, management offices are rushing to find the next edge.
 Former A’s GM and sabermetric pioneer Billy Beane
Billy Beane’s popularity was not just driven by a movie and book, however. During his reign from 1999-2012 (he actually started in 1995 but his drafting and acquisition decisions did not begin culminating until the late 90s) the Oakland A’s posted a .527 winning percentage from a record of 1621-1453. During this time he had over 90 wins, a great achievement in baseball, on 8 different occasions and made the postseason on 6 different occasions.8 Billy Beane and crew were also able to sabermetrically mine hidden prospects like Nick Swisher, Joe Blanton, Barry Zito, Mark Mulder, Bobby Crosby, and submarine reliever Chad Bradford.
Because of the driven towards statistics driven baseball, teams needed management that were skillful with numbers and applying them to human interaction. Consequently, economists began to fill the ranks. Of the general managers in baseball today, Matt Klentak of the Philadelphia Phillies, Dick Williams of the Cincinnati Reds, Mike Chernoff of the Cleveland Indians, Jeff Luhnow of the Houston Astros, Derek Falvey of the Minnesota Twins, Mike Girsh of the St. Louis Cardinals, Matthew Silverman of the Tampa Bay Rays, and Ross Atkins of the Toronto Blue Jays all have undergraduate degrees in economics or finance.4 The L.A. Dodgers quit beating around the bush and hired a full-on Ph.D. in Economics from the University of California, Berkeley in Farhan Zaidi. In the baseball executive world, math skills have overtaken baseball skills with only 1 current GM having played.5
 Dodger’s GM and Ph.D. economist Farhan Zaidi
Economists are not only ruling the front office. The more advanced sabermetric and baseball forecasting systems have been developed by economists. A quick scan of Fangraphs’ writers shows economists popping up everywhere.6
In the baseball executive world, math skills have overtaken baseball skills with only one current GM having played.
The by far most well-known sabermetrician not holding a team executive position is stat king Nate Silver. Before his days running the super popular FiveThirtyEight, Nate Silver first gained his statistics experience running Player Empirical Comparison and Optimization Test Algorithm or PECOTA. The goal of PECOTA was to predict the expected performance of any given baseball player or prospect either in the next season or throughout a whole career. Since its early founding, PECOTA has outperformed many established baseball forecasting systems.7
Kyle Hendricks: The Pitching Economist
To a scout or a self-described baseball expert, Cubs pitcher Kyle Hendricks has few qualities that would make you think he can pitch at the Major League level. To start, he was not a highly regarded prospect coming out of high school. He was denied scholarship offers from elite “baseball schools” and instead went to Dartmouth for academic reasons. His pitch velocity is extremely slow, most of his pitches do not top the mid-80s and he is getting slower every year.9 So how does this scrawny pitcher become subject to Cy Young talk every year? Well, to start, he has pin-point accuracy on his pitches, a variety of pitches, and an economics degree (with a minor in mathematics).

Kyle Hendricks, nicknamed “The Professor,” studies opposing hitters. Leading up to every game he goes through the entire batting lineup of a team, finding each batter's weaknesses and strengths and using it against them. With each at-bat, he goes in with a strategy. While Hendrick’s keeps most of his secrets to himself and his coaches, the sabermetricians are beginning to figure him out. Starting every at-bat, Hendricks “steals” a strike. The Professor has a belief that most hitters in the league will take on the first pitch to adjust to a pitcher, especially to a multi-pitch freak like himself. Hendricks is second in the league in first-pitch strikes, and averages almost 3 called first-pitch strikes for every swinging one.10 It as if hitters have just given up on the first pitch.
Additionally, Hendrick’s uses coach and hitter expectations to form his pitching style. He does this in two main ways. First, he has additional pitches that remain hidden, in addition to his already extensive known repertoire. For years he got away with a second changeup that was only relieved when sabermetricians noticed discrepancies between his changeup velocity and breaks.11 It was also found that he had a second curveball which has shown increased use over the years.12 Second, he goes against “conventional baseball wisdom” in pitch selection. While most baseball pitchers rely on the fastball as a primary pitch and breaking balls as a secondary pitch, Hendricks uses all his pitches with relative frequency. He lacks the primary-secondary pitch sequence. In complete ire of traditional baseball pitching style, Hendricks throws his changeup at a greater frequency (24.27%) than his four-seam (15.85%).13
Breaking New Ground with Game Theory
Although statistics have been an important part of baseball for the past 20 years, newer forms of mathematical thinking like game theory have yet to catch on. While few baseball players have any academic experience with game theory, a simplified version is well understood by every baseball player. Basically, an AB is much like a game of matching pennies. The pitcher benefits from a disagreement, while the batter benefits from an agreement. A good pitcher will thus try their best to create uncertainty for a batter.
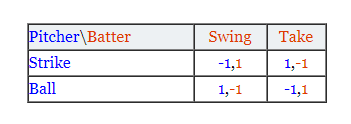 Simplified version of a zero-sum matching pennies game applied to baseball. [15]
This is, of course, an oversimplified version of the baseball. Adding variables like batter/pitcher matchup, men on base, score, inning, lineup, etc all would make the game more and more complicated, and requires an analysis that would exceed the capacity I am willing to do for this blog post. An illustration of this complexity can be found from a UC Berkeley paper on the 8th inning of a game between the Giants and Dodgers14. Game theory has also begun to creep into the amateur baseball blogs15.6 Perhaps in the future game theory will take over the baseball world.
So far, the limit of game theory in baseball has been in an academic context. A great analysis of a game can be found here. This paper analyzes the 8th inning the April 18th, 2010 game between the LA Dodgers and the San Francisco Giants. Although this paper features just two batters in one-half inning it illustrates how game trees in baseball quickly become complex. Perhaps the greatest challenge to game theory and baseball has been the complexity involved. So many factors have to be taken into consideration for something as simple as where to pitch.
To conclude, baseball has become a bit of a hobby for economics, mathematics, and statistics majors like myself. Through the sport’s unique design, a fan can participate, not as a player, but an analyst. Through the democratization of information via the internet, being a baseball fan is a totally different experience than 50 years ago.
______Featured image: Citizens Bank Park looking north toward central Philadelphia. Photo credit: Penn State Bibliography Puerzer, R. J., (2002) From Scientific Baseball to Sabermetrics: Professional Baseball as a Reflection of Engineering and Management in Society. NINE: A Journal of Baseball History and Culture (11)James, B., Birnbaum, P., Roney, S., Pavitt, C., Palmer, P., Blau, C., . . . Mednick, B. (n.d.). Baseball Analyst archives. Retrieved from http://sabr.org/research/baseball-analyst-archivesLewis, M. (2003). MoneyBall. New York, NY: W. W. Norton & Company.List of current Major League Baseball general managers. (2017, October 2). Retrieved from https://www.baseball reference.com/bullpen/List_of_current_Major_League_Baseball_managersJohns, G. (2015, September 28). Jerry Dipoto named Mariners general manager.Fangraphs Writers. (2017, September 15). Retrieved from https://en.wikipedia.org/wiki/Fangraphs#Regular_writersSilver, N. (2004, January 15). PECOTA Takes on the Field: How'd it Fare Against Six Other Projections Systems?Oakland Athletics Team History & Encyclopedia. (n.d.). Retrieved from https://www.baseball-reference.com/teams/OAK/index.shtmlKyle Hendricks. (2017, October 25). Retrieved from http://www.fangraphs.com/pitchfxo.aspx?playerid=12049&position=P&pitch=SI&data=piEckert-Fong, T. (2016, August 17). Why do hitters rarely swing at first pitches from Kyle Hendricks? Retrieved from https://www.beyondtheboxscore.com/2016/8/17/12505864/kyle-hendricks-cubs-first-pitch-strike-swingSarris, E. (2015, October 20). Kyle Hendricks Has Two Changeups. Retrieved from https://www.fangraphs.com/blogs/kyle-hendricks-has-two-changeups/Weinberg, N. (2016, October 28). The Evolving Curveball of Kyle Hendricks. Retrieved from https://www.fangraphs.com/blogs/the-evolving-curveball-of-kyle-hendricks/Kyle Hendricks: Trajectory and Movement. (n.d.). Retrieved from http://www.brooksbaseball.net/tabs.php?player=543294&time=&startDate=03%2F30%2F2007&endDate=09%2F30%2F2017&s_type=2Geblem, Laucys, Saperstein, & Sodha. (2010, May 13). The Game Theory of BaseballSwartz, Matt. “Game theory and baseball, part 1: concepts.” The Hardball Times, Fangraphs, 17 Dec. 2012, www.fangraphs.com/tht/game-theory-and-baseball-part-1-concepts/.Greenberg, G. (2010, Fall). Does a Pitcher's Height Matter? Retrieved from http://sabr.org/research/does-pitcher-s-height-matter Further Readinghttp://www.mathaware.org/mam/2010/essays/AlbertSabermetrics.pdfhttp://sabr.org/sabermetrics
Britain's decision to leave the European Union continues to prompt more questions than answers for global markets.October 23, 2017By Nazmus Mallick
June 23, 2016 is a day redefined Britain’s relationship with the world. It has been sixteen months since the British people voted in a referendum to withdraw their country from the European Union (EU). As predicted by countless experts in academia and industry, the British economy is currently undergoing a period of uncertainty. Some of its closest trading partners, mainly United States, are carefully observing fluctuations in the British economy to see how any bilateral negotiation with a more isolated Britain will impact Anglo-American trade.On June 24 at 12:28 AM Manhattan time, the value of pound experienced a plunge against the US Dollar to its lowest level in 31 years (Figure 1).
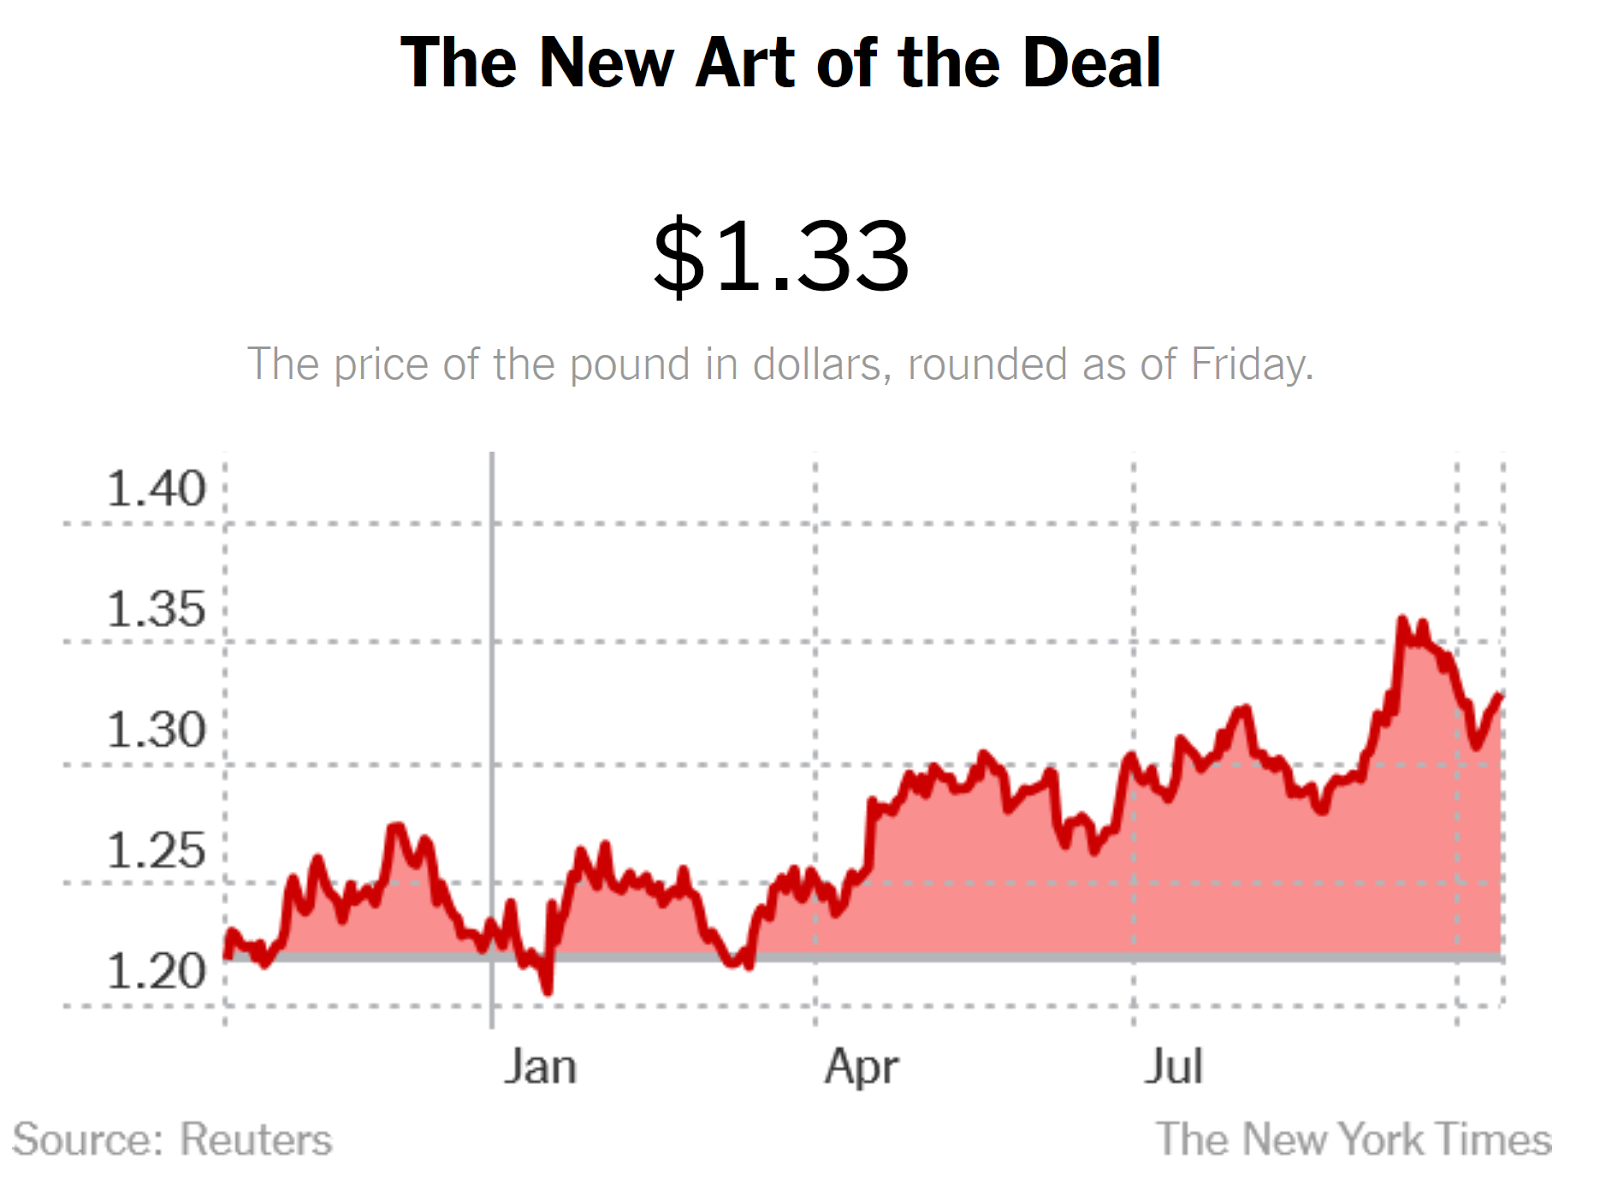
Figure 1
According to The New York Times, the pound has dropped 10% since it was valued at $1.47 just before the decision to leave the EU. The most obvious cost of the plummeting value of the pound is the rising cost of imports. British people will no longer be able to enjoy foreign luxury goods due to rising prices and so will be deterred to make further purchases of imported goods overall. An example of this effect is seen between Unilever and a supermarket chain as the former threatened to withdraw products such as Marmite, a yeast-based spread, from the shelves. Items from Apple and Microsoft also saw increase in prices throughout the British market. A significant amount of British jobs are at stake. Once Britain is denied access to the common market, economists predict that British firms will be forced to lay off workers. Around 25% of financial companies are expected to move their operations overseas due to the cloud of uncertainty. Major investment banks like Goldman Sachs, JPMorgan, and Morgan Stanley are expected to move key operation divisions to Frankfurt, Paris or Dublin in order to hedge from any upcoming risk. This decision brought some negative signs for Americans. According to Washington Post’s Ylan Mui, more than a million people in Britain is employed in American businesses. The uncertainty that surrounds this decision is enough to jeopardize the job security of these workers.
Around 25% of financial companies are expected to move their operations overseas due to the cloud of uncertainty.
Furthermore, this article also suggested that US is the single largest investor in Britain. Many firms in US consider UK to be the main way to conduct businesses with all the 28 nations of the EU. For this reason, a departure from the EU will hurt US businesses very sharply by restricting access to these markets, reducing the revenue streams of US businesses, and forcing firms to shift their operations in the European markets in other places. The negative effects of these factors can be manifold. There will be a serious decline in exports of US products as they will become very expensive.
Caterpillar opened its first factory in Britain more than 55 years ago. It currently employs 9000 employees and operates 16 plants across Britain. Around a quarter of Caterpillar’s sales revenue come from European businesses. This poses unprecedented risk for the business community in Europe, as it will likely trigger a decline in Europe-centered sales for Caterpillar.
The Federal Reserve has been under the dilemma of raising short term benchmark interest rates. Brexit has intensified the Fed’s prospects for action. Since the Great Recession, the Fed has maintained interest rates at rock-bottom levels in an effort to spur consumption and boost aggregate demand. Brexit is cold make the waiting period for raising rates lengthier. According to Rana Foroohar of Time Magazine, the balance between costs and benefits has been deteriorating and this is very clearly seen from growing corporate debt, hesitancy of consumers to increase their consumption as they are uncertain about the strength of the recovery, etc. Since 2008, legislators were very reluctant to pass fiscal measures for an accelerated recovery. As a result, this placed increased responsibility on the central bank to steer the economy, maintaining strong growth and maintain price stability. However, rising corporate debt and shrinking economic growth associated with the crisis has put increased pressure on the banks to cope with the situation. They don’t have sufficient liquidity due to default risks and so national governments will have to take on this additional responsibility.
While uncertainty has creeped into the British economy, causing its growth to lag behind all developed countries, there are signs for calm. London is likely to remain an unrivaled center of finance due to its long-rooted institutions. International firms such as Facebook and Bloomberg LP are setting up their headquarters along the Thames at the same pace as banks reallocate divisions to other European capitals. The disruption of human capital can pose further challenges, forcing the Conservative May Government to announce actions regarding labor regulation that the Peterson Institute has criticized as being out of the “Pre-Thatcherite Labour rhetoric”. If legislators on both sides of the Atlantic can take preventive measures from any unwanted shocks, it can serve as a valuable safeguard for the economies of both, the United States and Britain.
____
Featured image: Central London. The River Thames flows south of Buckingham Palace, St. James Park, Westminster and Whitehall. Upon bending eastward at Charing Cross, it swerves through the financial districts of City of London and Canary Wharf in the distance. Credit: Jason Hawkes
ReferencesIndependent. Chu, Cox and Rodionova, (22 June, 2017). Brexit: The economic and business cost to Britain one year after the vote. Retrieved October 14th 2017, from http://www.independent.co.uk/news/business/news/brexit-latest-news-business-economic-costs-banks-one-year-vote-anniversary-eu-exit-a7802596.htmlThe Washington Post. Mui Y, (June 18, 2016). ‘Brexit’ could send shock waves across U.S. and global economy. Retrieved October 14th 2017, from https://www.washingtonpost.com/news/wonk/wp/2016/06/18/how-brexit-could-hurt-america/?utm_term=.bc6ee92a9930NurseBuddy. Retrieved October 14th 2017 from https://nursebuddy.co/blog/brexit-mean-uk-care-companies/Time. Foroohar (June 27, 2016). Why Brexit Really Is a Big Deal for the U.S. Economy. Retrieved October 14th 2017 from http://time.com/4383202/brexit-america-fallout-economy-fed/
Cryptocurrencies are a rising phenomenon...maybe? October 2, 2017By Patrick Reilly
Cryptocurrencies such as Bitcoin, Litecoin, Ethereum and others have been gaining popularity. While still not generally understood by the average person, these “currencies” have risen exponentially in value over recent years. This has attracted the attention of such notorious investors as self-described Floyd “Crypto” Mayweather, Barcelona soccer player Luis Suarez and famous person Paris Hilton.


So what exactly is cryptocurrency and what is it you used for? According to Investopedia, cryptocurrency is “a digital or virtual currency that uses cryptography for security...is not issued by any central authority, rendering it theoretically immune to government interference or manipulation.” So cryptocurrencies such as bitcoin are completely digital and aren’t owned by anyone. There is no sort of “internet federal reserve” out there controlling bitcoin as a currency, this lack of control amazingly works and provides one of the benefits of bitcoin: nearly non existent transaction fees. Whenever you buy something with your credit card from Visa or Mastercard there’s nearly a 3% fee that is deducted. There is also no way to tax purchases done through bitcoin because there’s no one overseeing the currency and tracking every purchase. Many of the other advantages of bitcoin mostly apply to those who work outside of the law. There is no enforcement mechanisms that can freeze a bitcoin account like they could freeze a standard bank account. Also since there is no one tracking bitcoins--they can be used safely for illegal activities on the internet, such as drug trafficking and money laundering.
Now why are cryptocurrencies gaining popularity and why on Earth is Paris Hilton involved? This is most likely because of the exponential rise in the price of a single bitcoin and the success of other online currencies. Everyone who thinks that Bitcoin is the way of the future is looking back at the price of one bitcoin around 2010 and they don’t want to make the same mistake again. One Norwegian man was lucky enough that he wrote a thesis on encryption and just decided to buy about $25 of bitcoin in 2009. He forgot about it for 4 years until he saw bitcoin on the news, that $25 today would be worth about $18,500,000. While that’s great for that guy, in my opinion, speculation is the main reason that bitcoin has had such an incredible rise. People buy bitcoin, wait for the price to rise and then sell it to the next fool who wants to do the same thing. I see bitcoin as a game of musical chairs between speculators and once the music stops there will be a steep decline in the already volatile currency.
Jamie Dimon, CEO of JPMorgan, recently said that “cryptocurrencies are creating something out of nothing that to me is worth nothing”.

While I will not be an investor in bitcoin I do see the potential that others see. The potential for internet payments that aren’t government tracked, taxed or come with ridiculous fees. On the other hand paying thousands of United States dollars for one unit of an internet currency with no tangible value or hard assets behind it seems like the definition of a bubble.
______ References Kessler, Andy. (2017, August 27) The Bitcoin Valuation Bubble. Retrieved fromhttps://www.wsj.com/articles/the-bitcoin-valuation-bubble-1503868225Investopedia. Cryptocurrency. Retrieved fromhttp://www.investopedia.com/terms/c/cryptocurrency.aspInvestopedia. What are the advantages of paying with Bitcoin? Retrieved fromhttp://www.investopedia.com/ask/answers/100314/what-are-advantages-paying-bitcoin.aspGraham, Luke. (2017, September 22) Governments will close down bitcoin and cryptocurrencies if they get too big, warns Jamie Dimon. Retrieved fromhttps://www.cnbc.com/2017/09/22/bitcoin-jpmorgans-jamie-dimon-lays-into-bitcoin-again.html Author: Patrick ReillyNote: This Volume was previously published on September 26, 2017. The online upload date does not reflect the original publication date.
September 19, 2017By Nicolas Guerrero
Glass-clad skyscrapers rise above a palm-lined waterfront. The financial district, bustling with foreign expats, lies surrounded by the pristine waters of the Persian Gulf. Opposite the harbor is the Museum of Islamic Art, an iconic limestone structure designed by American architect I.M. Pei. The nearby historic quarter is undergoing a multi-billion dollar revitalization as a world-class cultural destination, and the leading fashion houses of Paris and Milan are betting on premium square footage along downtown’s future climate controlled boulevards. A constant flow of jet streams come from the east, where an alluring new airport seeks to become the new hub of intercontinental connections.
Doha—the royal capital of Qatar—spares no detail in showcasing its economic prowess.
Qatar is a country of inverse proportional dimensions. Of the emirate’s total population of 2.6 million, only 310,000 are citizens. The remaining 2.3 million are mainly western expatriates. It is a small cape, roughly the size of Delaware, jutting north from the Arabian Peninsula. Yet it is the wealthiest country in the world by per capita income. Qatar’s economy is propelled by vast reserves of oil and natural gas (see figure 1). The massive revenues from natural resources are reinvested through the government’s enterprising sovereign wealth fund in prominent assets throughout the world. The Emir, Tamim bin Hamad Al Thani, came to the throne determined to follow his father’s legacy of making Qatar push above its weight. The country’s determination to become an influential player in global geopolitics has come at a cost, and now its royal family must decide how to navigate Qatar through the worst diplomatic crisis in its 46 year-long history.

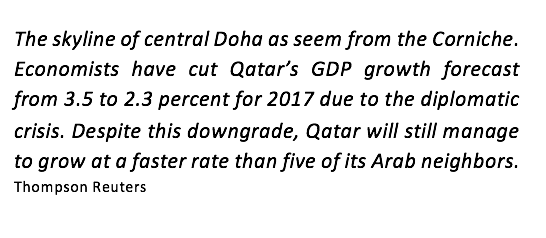
On June 5, 2017 Saudi Arabia, the United Arab Emirates, Bahrain, Egypt, and Yemen withdrew their ambassadors from Doha, effectively breaking diplomatic relations with Qatar. The countries involved accuse the Qatari monarchs of financing radical terrorist groups, interfering with the domestic affairs of countries in the Gulf Cooperation Council (GCC), and maintaining diplomatic ties with Iran, the Arab world’s most feared adversary.
Qatar, one of the smallest states in the region has managed to be far more influential than its larger neighbors would see as convenient. Mass media is one of the multiple factors that neighboring states fear is key in the potential destabilization of their societies. Al Jazeera is a news broadcaster headquartered in central Doha and owned by the State of Qatar. It has bureaus in six continents and a Western affiliate, Al Jazeera English. The network has provided a platform to extremely controversial figures with implications of antisemitism and Wahhabi radicalism. In 2013 the Egyptian government accused journalists working for Al Jazeera of collaborating with the Muslim Brotherhood and spreading false news. Likewise, Al Jazeera was banned in India after displaying disputed maps of India’s claim over Kashmir on its broadcast. Even though Al Jazeera has denied all allegations of bias and antisemitism, the network is perceived to be the state-owned broadcaster of the Qatari government. The United States Department of State claims that the Qatar government manipulates Al Jazeera coverage to suit the monarchs’ own political interests.1 It appears that through mass communication, Qatar has at least been able to maneuver the direction of popular opinion across the region, in ways that its neighbors find disconcerting.
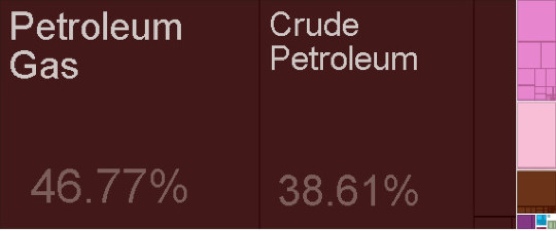
The Qatari throne has long tried to balance the adversarial forces that surround it as a neutral state intentionally playing dual roles. Doha has provided financial networking to groups that while not linked directly to terrorism, are providing support to individuals who escalate intra-Arab tensions. Yet Qatar also participated in the Saudi–led intervention in Yemen against the Shi’ite Houthi militias, while maintaining robust diplomatic ties to a Shi’ite Iran. Qatar is home to the largest American base in the Middle East, yet in 2013 the Taliban opened an office to “facilitate reconciliation” in Doha a short distance from the United States Embassy. This office was closed shortly after due to international pressure.
The response from Washington has been mixed. The Saudi-led blockade of Qatar came in the weeks following President Donald Trump’s visit to the Middle East. It is still unclear how the talks and closed-door efforts between Mr. Trump and the Saudi monarch influenced their decision to single out Qatar as a threat to the region. The hacking attack on Qatar’s state-run news agency, where allegedly false comments from the Qatari emir regarding Hamas, Israel and support of Iran were published online, seems to have been the tipping point in a heated relationship. President Trump lambasted Qatar shortly after leaving Saudi Arabia in the following Tweet:
“During my recent trip to the Middle East I stated that there can no longer be funding of Radical Ideology. Leaders pointed to Qatar - look!”
Donald J. Trump - 6 June 2017 - 5:06AM
Everything moved very quickly. It had been less than a month when Mr. Trump had met with Hamad Al Thani and discussed Qatar’s purchase of “lots of beautiful [American] military equipment.”
U.S. Secretary of State Rex Tillerson, former CEO of ExxonMobil implying a grasp of knowledge in the resource-rich region, called for quick cooperation within the GCC. Obama-administration officials have expressed doubt as to whether Mr. Trump realizes that the Al Udeid Air Force base in Qatar is home to two thousand American troops and the launch site for allied military strikes against the Islamic State.
A reliable façade for Qatar’s questionable diplomatic efforts is its role as an economic powerhouse.
Rising 300 meters over the south bank of the River Thames in London is Western Europe’s tallest building. A glittering skyscraper designed by Italian architect Renzo Piano. The Shard—as it is called—is a mixed use glass structure housing corporate offices, including the sleek broadcasting studios of Al Jazeera English on the sixteenth floor. The midsection houses a lavish Shangri La Hotel, with restaurants and suites offering the highest views of any accommodation in the capital. The uppermost tier, is comprised of ten residences, where “residents can wake up to views of the North Sea and have delicacies lifted from the hotel below”. The State of Qatar developed and owns 95 percent of the Shard. It is the crowning symbol of massive Qatari investments in the United Kingdom.
The flow of investments from Qatari funds into quintessentially Western assets has become a staple of the Emir’s efforts to display Qatar’s positive influence. The Qatar Investment Authority (QIA) is as much of a political extension of the government as it is a financial one. In 2012 QIA acquired the London headquarters of Credit Suisse along with a 6% stake in the bank. QIA then purchased the iconic Harrods department store in the London borough of Knightsbridge and opened a branch store in the newly opened Doha International Airport. In France, the wealth fund completed the purchase of football club Paris-Saint Germain F.C. for a total of $130 million. In 2017 the now Qatari-owned football club engaged in the most expensive association transfer in history, paying Brazil’s Neymar a record $198 million to relocate from F.C. Barcelona. In New York, the Qataris have purchased a total of $3.5 billion in properties and paid a record $2.5 billion to BlackRock for a corporate tower in Singapore2.
These investments are dealt through Qatar Holdings, the investment branch of the country’s sovereign wealth fund. It receives periodic funding from the throne. The ruling family has positioned Qatar in the awkward position of avoiding tense confrontation with its neighbors, while maintaining ties to governments openly hostile toward its closest partners. The diplomatic crisis has put a strain on Qatar’s ambitions of grandeur. Qatar Airways, the flagship carrier operates a sprawling fleet of aircraft fitted with the most frivolous of amenities ranging from cocktail lounges to lavatories featuring Armani toiletries. With surrounding airspace closed for Qatar-bound flights, the company has been forced to deviate hundreds of flightpaths southward over the Gulf of Oman increasing the costs of fuel and losing potential passenger loads over longer flight times. In addition, the airline has been banned from operating in any of the countries involved in the dispute.
Not any less problematic is Qatar’s development efforts ahead of the FIFA World Cup it will host in 2022. The blockade on the Saudi-Qatar border is preventing raw materials used in the construction of massive stadiums from entering the country. According to the Financial Times, imports have fallen by 40% compared to last year. The blockade has put a strain on essentials such as food and medical imports. 4000 dairy cows had to be flown in as a basic measure to sustain the population’s needs.
According to the Eurasia Group, Qatar used $38.5 billion to support its economy in the first two months of the diplomatic crisis. This is equivalent to of 23% of its GDP.
Qatar is not desperate. In a poll conducted of 12 economists at Thompson Reuters, GDP growth forecasts have been cut by 1.2 percent for 2017. Yet Qatar remains the strongest performer in the region. Even with next year’s revised growth forecasts, the country is expected to outperform its neighbors. Qatar’s abundant foreign exchange reserves have cushioned the effects of sanctions, even after hitting their lowest level in five years (Figure 2). In case the reserves become too dwindled, QIA is ready to restock the central bank with $180 billion being held in foreign capital. Continuity in hydrocarbon exports have reassured weary observers of any major shock to the economy.
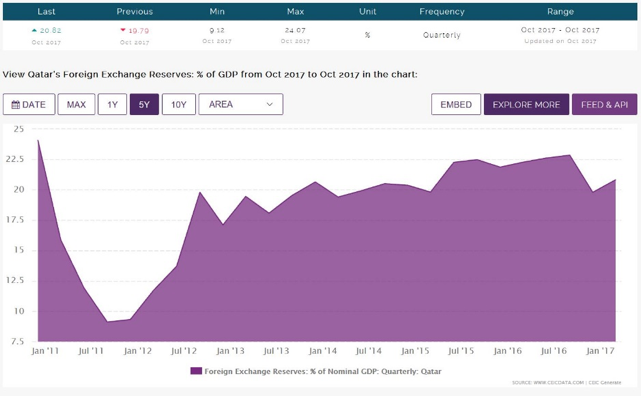
Side effects to the short-run state of the economy include slightly higher consumer price inflation and higher costs for shipping imports causing delays in ongoing construction projects throughout the country. This may lead to a possible strain in private-sector investment. FIFA and third party organizers of World Cup infrastructure have been made aware of the diplomatic crisis but the event continues as planned. According to Qatar 2022’s deputy secretary of delivery, Nasser Al Khatter, incoming shipping routes have had to diverge to ports in neutral states such as Oman, Kuwait and predictably, Iran.
The region has been in constant turmoil since the end of the Second World War. Some scholars would argue that intra-Arab conflicts and especially Inter-Islamic conflicts date back centuries. Saudi Arabia thinks of itself as something so much more than a country. The House of Saud emphasize their role as custodians of the two holy mosques at Makkah and Medina—the two holiest sites in Islam. They are willing to work with partners and unlikely world leaders to deter any rivalry to geopolitical superiority, especially if it compromises their coalition of Sunni neighbors against the powerful Shi’ite state of Iran, just across the Persian Gulf. Qatar and Saudi Arabia have more in common than they would currently admit to recognize. Both are resource-rich, absolute monarchies with harsh theocratic proclivities. Yet their quest to tweak the definition of sovereignty and be unique players on the regional stage led them to play a game of chicken and show the West which state would turn on the other’s implied weaknesses first. For now, Saudi Arabia has the upper hand and their demands will echo those of smaller Arab states, but geopolitical ambitions also imply that two rational actors eventually see the world through the lens of realism.
_________ References
Donald Trump has run a presidential campaign branded on populism which rejects the global and domestic economic system developed by the two major political parties since World War II. Though politically appealing to a large segment of the population, Trump’s economic policies endanger the U.S. economy exponentially more than those of any presidential candidate of a major U.S. political party in history. The most severe (and hardly the only) economic dangers of a Trump presidency include the erosion of the dollar’s status as the world’s reserve currency, a recession longer than the one in the late 2000s, and the end of U.S. government debt’s status as the least risky asset in the world. If any of these three dangers are realized, there will be a sudden and indefinite collapse in the investment of stocks and real estate that Americans depend on for retirement and employment with firms of all sizes. For these reasons, Trump is the most irrational choice this year’s American voters have ever had in their lifetimes.By Adam SmithEditor’s Note: The views expressed by this author do not reflect the official views of the Penn State Economics Association or the views of the employers of any current or former member of the Penn State Economics Association. For purposes of ensuring readers do not infer otherwise, the author of this post is using a pseudonym.The intellectual level of public discourse in the United States has been reduced to that of a third-grade elementary school student. This is not hyperbole; that is actually the reading level of Donald Trump’s diction during the past year-and-a-half. This would only be a mild nuisance if Trump was just bungling the United States Football League, suing a securities analyst for correctly predicting the failure of the Trump Taj Mahal, or “literally sold almost no steaks” in his hilariously awful business plan to sell Trump Steaks at The Sharper Image. Yet, Trump—a man with no government experience, breathtakingly scant public policy knowledge, and horrendous personal character—is somehow the Republican Party’s nominee for President and FiveThirtyEight’s Polls-Plus Model projects he has roughly a 35% probability of winning the general election on Tuesday.Sadly, the comical failures listed above understate Trump’s failures as a business executive and fail to adequately articulate the dangers of his potential ascendance to the Presidency. Trump’s stated net worth of $2.9 billion means the real estate mogul underperformed four decades of returns on the real estate market (FTSE NAREIT All Equity REITS Index) by 57%, or left $13.2 billion on the table because of his bad decisions like the Trump Taj Mahal. Setting aside for now the specious logic underlying his economic policies, Trump has no experience in his business career that should inspire confidence in the public that he is qualified for the Presidency.To the contrary, his boasting on tape of having committed acts that are legally defined as sexual assault, refusal to disavow support from Ku Klux Klan Grand Wizard David Duke, demagogic rhetoric and policy proposals attacking Muslims and Mexicans, and shameful personal indulgence of donations belonging to a private charity are just a few of the many actions which rightfully make investors and citizens fearful of political and economic instability if he wins the election. Trump’s actions validated the reported decisions of Republicans like Ohio Governor John Kasich, U.S. Senator John McCain of Arizona, former Florida Governor Jeb Bush, former U.S. Presidents George H.W. Bush and George W. Bush, former Secretary of Defense Colin Powell, former Secretary of State Condoleezza Rice, and former Massachusetts Governor Mitt Romney to take a stand against their own party’s presidential nominee. Far more important than Trump’s underwhelming business record, the fact that Trump does not deserve the unity of his own party makes it impossible to conclude he can unite Congress behind sound economic policies. These factors are responsible for the apprehension of global investors and consumers as the election looms, but Trump’s feeble attempts at policy prescription—inseparable from the demagoguery he has displayed in this election campaign—is arguably the biggest source of anxiety of all.The World is Watching: Trump’s Abandonment of Globalization Would Threaten America’s Status as the Safe Haven of Financial MarketsThe mythology that Trump is a business genius who would correct the (admittedly real) partisan dysfunction in Washington, D.C. inevitably leads to the dangerous abandonment of the foundations of global economic growth since World War II. It is also an abandonment of the Republican Party’s stance for decades in favor of free trade. The essence of Trumpism is the notion that foreign entities—namely corporations and governments, but also notably refugees and illegal immigrants—are conspiring to undermine American institutions. In his attempt to argue this point, Trump claims, “We’re losing a tremendous amount of money, according to many stats, $800 billion a year on trade…So we are spending a fortune on military to lose $800 billion. That doesn’t sound like it’s smart to me.” His prescription? A 45% tariff on Chinese imported goods, a 35% tariff on Mexican imported goods, and repeal of trade agreements like the North American Free Trade Agreement. It underlies a pathos appeal which resonates with Americans nostalgic for the more closed economy their parents and grandparents experienced before World War II. It also fundamentally misrepresents the United States’ role in the global economy and ignores the benefits it reaps from globalization.As New York Times economic correspondent Neil Irwin writes, “trying to eliminate the trade deficit could mean giving up some of the key levers of power that allow the United States to get its way in international politics.” The dollar has been a global reserve currency since the Bretton Woods agreement in 1945, meaning that parties around the world use it for transactions in which the U.S. has no direct involvement. Its status as the centerpiece of global finance gives the U.S. government unparalleled power to enforce sanctions against Iran, Russia, North Korea, and terrorist groups by cutting off access to the dollar payments system to any bank in the world. Isolationists within Trump’s base of support might shrug at this benefit, but the U.S.’s power in the international political sphere is inseparable from the dollar’s status as a reserve currency. Moreover, amidst the 2008 financial crisis, U.S. government debt saw its interest rates fall when other countries’ rose because of Treasury securities’ unique status as the safe-haven asset. The United States is unique among national economies in its ability to borrow cheaply to provide fiscal stimulus when it experiences a recession and when the federal funds rate is at the zero lower bound.All of this is relevant to Trump’s protectionist trade proposals because economist Robert Triffin warned that the provider of the global reserve currency must run perpetual trade deficits to keep the financial system stable. When nearly every country has a use for dollars, the upward pressure on demand for dollars makes exports more expensive and puts downward pressure on the price of imports in the U.S. In the 1940s, the U.S. was uniquely suited to be the global reserve currency due to the relative strength of its economy and standing as the global military superpower. It is because of the U.S. government’s continued spending on vast domestic infrastructure projects and military to secure hegemony that there is unmatched global demand for the dollar as a reserve currency. What other country could be safer for investing than the producer of the global reserve currency?Furthermore, it is evident Trump’s claim that perpetual trade deficits are a sign foreign countries are taking advantage of the U.S. is flatly wrong. It is true that when China netted a $366 billion trade surplus with the U.S. in 2015 that the Gross Domestic Product (GDP) for the U.S. was reduced at first, but something had to happen with that extra sum of money. If Chinese investors keep the money at home, the Chinese yuan would appreciate and goods would become more expensive in the U.S., thus negating the gains of its exporters. Instead, China and other export-intensive countries prevent their currencies from rising too high by investing in U.S. stocks and bonds, investing in factories in the U.S., or having the government buy assets directly. Far from being an inherent drag on the economy, the nature of these persistent trade deficits experienced by the U.S. are arguably the mechanism which make it the safe haven financial market of the world.This upward pressure on American assets provides high valuation of stocks and real estate, as well as low interest rates on fixed income assets relative to other countries, give American companies a unique advantage in financing. The effect is an advantage for those seeking to retire by generating a sufficient return on their investments. But if Trump signs the intensely protectionist legislation he is proposing and other countries respond with retaliatory tariffs of their own, the consequent slowdown in international trade could be enough to erode the status of the U.S. economy as a global safe haven and dramatically hit the wallets of Americans from every income bracket.The King of Debt: How Trump’s Fiscal Policies Would Explode the National Debt and Borrowing CostsWhile Trump deviates from the orthodoxy of the Republican Party on trade, he doubles down on it for the issue of taxation. Trump’s track record of insolvency in his business career and his actual proposals suggest a massive expansion of tax cuts and an increase in government debt far eclipsing that of his opponent. Yet, this in itself is not inherently alarming. Fiscal stimulus can be useful when monetary policymakers struggle with the zero lower bound (the effective federal funds rate is still historically low around 0.40%), as long as the stimulus is directed to activity which expands the economy. The problem with Trump’s version of fiscal stimulus is twofold: the nature of it is inefficiently allocated and the size of it undermines the creditworthiness of the federal government.It is not surprising that Trump unveiled a plan to significantly cut personal income tax rates due to the inherent positive reception of voters to receiving a tax cut. Bloomberg writer Richard Carroll shows there are some instances where tax cuts were a sensible solution to stimulating the economy, but also some where they failed to accomplish this end due to different economic conditions. The tax cuts proposed by John F. Kennedy and signed by Lyndon B. Johnson in 1964 successfully contributed to about 4.5% GDP growth for six years and shrank the debt-to-GDP ratio because marginal tax rates had been extraordinarily high—up to 91% for personal income (the top bracket). Ronald Reagan’s tax cuts made sense in 1981 because high inflation had arbitrarily pushed individuals into higher income brackets and firms had newfound incentives to invest with some additional fiscal stimulus in an environment of high interest rates. The main pitfall of Trump’s tax plan is the same as the one implemented by George W. Bush in 2001: tax cuts are not a magical panacea to every economic situation. In 2001, the job market was around full employment with an unemployment rate around 4.7%, the debt-to-GDP ratio remained moderately high at 56.4%, and the effective federal funds rate was relatively low at 3.97%. Consequently, GDP only saw an average increase of 2.7% between 2002 and 2006, following a stretch of five years where annual GDP growth exceeded 4% four times. Meanwhile, the debt-to-GDP ratio expanded by 28.8% during Bush’s presidency. Now, the unemployment rate is similarly low at 4.9%, debt-to-GDP is even higher around 75%, and the federal funds rate is even lower around 0.40%. The current economic conditions are even less suited to generate significant additional growth upon the injection of a large tax cut.Furthermore, the allocation of Trump’s tax cuts is primarily to high-income consumers who spend a significantly smaller proportion of any reduction in their taxes than do lower and middle-income consumers. Moody’s Analytics calculated the marginal propensity to consume (percent of income consumed) of those in the top income quintile to be 0.49 and these individuals would receive 72% of Trump’s tax cuts. That means only 49 cents of every dollar in the vast majority of Trump’s tax cuts would add to consumption in the U.S. This is in contrast to the bottom-quintile, whose marginal propensity to consume is 0.86 and would receive 2% of Trump’s tax cuts. Cutting taxes for lower-income earners, or enacting other fiscal policies which boost their incomes, is simply more efficient at stimulating consumption in the economy as a whole.This does not, in itself, refute the merits of cutting taxes primarily for high-income earners and capital gains income. If firms were constrained from expanding because of high borrowing costs, these individuals could use their savings to invest in them when they badly need capital. The problem with using that as a reason for implementing Trump’s plan now—in contrast to Reagan’s Presidency—is that the current market environment is such that stocks are very expensive: the S&P 500 has a historically high price-to-earnings ratio of 24.31, as of October 28. The P/E ratio was very low at 9.02 at the beginning of 1981, Reagan’s first year as President. Firms simply haven’t been having a problem raising capital because investors are in search for yield. Higher demand for financial assets would probably do little to increase future earnings. In essence, the marginal impact of Trump’s tax plan on economic growth would be underwhelming compared to past tax cuts.Of course, many of Trump’s supporters are likely to favor his plan not because they think it will stimulate the economy, but simply because they want to have more after-tax income. They should be warned they could easily actually be worse off under Trump’s tax and spending plans, especially if these individuals are not in the top income quintile. Moody’s Analytics wrote that if Trump’s plan is adopted at face value, the “nation’s debt load rises from 75% of GDP currently to over 100% by the end of Mr. Trump’s first term and more than 130% a decade from now. Long-term interest rates are much higher as a result. Over the next decade in the scenario where Trump wins the election, 10-year Treasury yields are expected to average 6.6%, compared with near 4% in the current-law scenario. Businesses’ cost of capital and households’ borrowing costs are much higher, despite the lower marginal rates, which act as a corrosive on investment and ultimately on productivity and GDP growth.” With the job market around full employment (4.7% unemployment) and Trump’s refusal to alter the largest drivers of increased government spending—Social Security and Medicare, it is likely that there would be quick crowding out effects under his fiscal policies: “the increased government borrowing causes interest rates to increase, crowding out private sector activities such as business investment, housing, and consumer spending on vehicles and other durables.” Ready or not, the self-proclaimed king of debt will surely live up to his name.The Trump Recession: A Perfect Storm The best case scenario of Trump’s economic plan is that there is an economic recession that is not as severe as the one in the late 2000s, but more prolonged. The worst is a catastrophe that has never happened before and would throw the basic principles of finance out the window.Along with the higher interest rates arising from his fiscal policies, Trump’s steep taxes on imports would hit the wallets of most Americans by increasing the prices of many goods ranging from groceries to clothing. It would replicate the effects of the Hawley-Smoot tariff law signed by Herbert Hoover during the Great Depression and similarly shrink global output at the worst possible time. Furthermore, Trump’s hardline plan to deport millions of illegal immigrants would also add to inflationary pressure by increasing the cost of labor for firms and decreasing output due to the lower labor supply. As a result, Moody’s forecasts the Federal Reserve to respond to this inflationary pressure with an increase in the federal funds rate in accordance with its congressional mandate to stabilize inflation.If Trump is elected and gets most of his policies adopted even in a modified form, Moody’s model forecasts all of these factors would cause a recession beginning in 2018 that would last longer than the 2000s Great Recession. The model predicts it would result in 3.5 million Americans losing their jobs, unemployment rising to 7%, and a sizable fall in home prices and stocks. Movements in futures contracts during the presidential campaign also provide a strong signal that investors would price in the effects of Trump’s policies as soon as Wednesday. During the first general election debate, Trump’s odds of winning fell by 5.2% and S&P 500 futures rose by 0.8%. Given that there were no other significant news events during this two-hour window and that price movements are typically minimal then, it is reasonable to assume a direct connection between these two shifts. It corresponds to a 15.38% difference in the value of the S&P 500 between a certain Trump victory and a certain Trump loss.Though the expected effect of Trump’s presidency on the population’s wealth is large, this is largely due to the uncertainty of what events his election would bring. It is possible that Trump would govern as a more conventional politician than his rhetoric suggests, so volatility in both financial markets and the real economy could be mitigated. On the other hand, it is also possible (and in my opinion, more likely—considering that Trump’s only consistent trait is his erratic behavior) that the market has not priced in the full extent of Trump’s irrationality and its economic consequences.Take, for instance, Trump’s suggestion that “[b]ringing back the gold standard would be very hard to do, but, boy, would it be wonderful. We'd have a standard on which to base our money.” The events of the Great Depression demonstrate that the gold standard was actually a disastrous policy. According to Wall Street Journal economics commentator Greg Ip, “In 1929, a recession in the United States caused prices, output and imports to plunge and the trade surplus to surge. This drew in gold from its trading partners, forcing them to raise interest rates. When European central banks tried to ease monetary policy, speculators guessed they would devalue, and pulled their gold out, causing the money supply to contract.” If Trump had appointed individuals who espoused these ideas to the Federal Reserve Board of Governors prior to the 2008 financial crisis, the Fed would have been unwilling to expand the money supply by lowering the federal funds rate and undertaking quantitative easing—the central bank’s purchase of long-term Treasuries and other fixed-income assets which kept interest rates low in the aftermath of the crisis. The recession would have literally followed the script of the Great Depression.But the worst scenario of all becomes horrifyingly plausible to imagine when one considers Trump’s comments that he would not pay back the government’s creditors in full in the event that there is a recession in his presidency: “You go back and say, hey guess what, the economy just crashed. I’m going to give you back half.”A few recent events suggest this idea (and Trump’s track record of undertaking similar actions as a business executive) could lead to catastrophic volatility in financial markets eclipsing the 2008 crisis in severity. For instance, Congress already flirted with a default on Treasuries in 2011 (and again in 2013) when $6 trillion of value from global stocks was eliminated by the time the two parties agreed to raise the debt ceiling. Moreover, the $19.8 trillion of outstanding government debt is more than 38 times the $517 billion Lehman Brothers owed when it filed for bankruptcy, and the stock market lost almost half its value in the five months after that happened. A big reason why Lehman’s collapse was so devastating was because its counterparties discovered the collateral they thought was backing their loans in the repo market couldn’t be returned. This problem would be even worse if Trump does not pay back creditors in full because at least $2.8 trillion of Treasuries served as collateral for repo and reverse repo loans as of 2013 (likely more Treasuries serve as collateral since that time), according to Fed data. If Treasuries were no longer eligible as collateral, the losses for lenders and borrowers could be unprecedented. This has never happened before, so it is impossible to quantify the damage precisely. However, the idea of $19.8 trillion in risk-free assets suddenly taking a haircut means markets would have to price in an unprecedented high risk discount to nearly all assets ranging from stocks to houses. It would be a recipe for millions of Americans to foreclose on their homes and firms to collapse. Modern portfolio theory would be moot.Trump did walk back his comments, but he demonstrated a hazy (at best) understanding of public finance in the process. He still has not retracted his support for Congressional Republicans’ failed attempt to defund Planned Parenthood and force another government shutdown in 2015, suggesting he remains willing to use the risk-free status of Treasuries as a political football. Trump should instead heed the advice of Warren Buffett who said of using the debt limit as a weapon, “It should be like nuclear bombs, basically too horrible to use.” Of course, Trump has apparently not fathomed that actual nuclear bombs are too horrible to use either. Don’t hold your breath, America. SourcesBerman, Russell. “Donald Trump Brings Back the Talk of Default.” The Atlantic. 22 Jun. 2016. http://www.theatlantic.com/politics/archive/2016/06/donald-trump-brings-back-the-default-talk/488270/Carroll, Richard. “When Ideology and Tax Cuts Mix, the Economy Loses.” Bloomberg. 27 Jun. 2012. https://www.bloomberg.com/view/articles/2012-06-27/when-ideology-and-tax-cuts-mix-the-economy-is-the-loser“Donald Trump won’t take nuclear weapons off the table.” MSNBC. 30 Mar. 2016. http://www.msnbc.com/hardball/watch/donald-trump-won-t-take-nukes-off-the-table-655471171934Everett, Burgess. “Trump: Shut down the government to defund Planned Parenthood.” Politico. 4 Aug. 2015. http://www.politico.com/story/2015/08/donald-trump-government-shutdown-planned-parenthood-120981Farenthold, David A. “Trump bought a 6-foot-tall portrait of himself with charity money. We may have found it.” The Washington Post. 14 Sep. 2016. https://www.washingtonpost.com/politics/a-clue-to-the-whereabouts-of-the-6-foot-tall-portrait-of-donald-trump/2016/09/14/ae65db82-7a8f-11e6-ac8e-cf8e0dd91dc7_story.htmlFarenthold, David A. “Trump recorded having extremely lewd conversation about women in 2005.” The Washington Post. 7 Oct. 2016. https://www.washingtonpost.com/politics/trump-recorded-having-extremely-lewd-conversation-about-women-in-2005/2016/10/07/3b9ce776-8cb4-11e6-bf8a-3d26847eeed4_story.html“FiveThirtyEight 2016 Election Forecast.” FiveThirtyEight. 6 Nov. 2016. http://projects.fivethirtyeight.com/2016-election-forecast/?ex_cid=rrpromo#plusGraham, David A. “Which Republicans Oppose Donald Trump Cheat Sheet.” The Atlantic. 6 Nov. 2016. http://www.theatlantic.com/politics/archive/2016/11/where-republicans-stand-on-donald-trump-a-cheat-sheet/481449/Ip, Greg. “What Republicans Get Wrong About the Gold Standard.” The Wall Street Journal. 12 Nov. 2015. http://blogs.wsj.com/economics/2015/11/12/greg-ip-what-republicans-get-wrong-about-the-gold-standard/Irwin, Neil. “What Donald Trump Doesn’t Understand About the Trade Deficit.” The New York Times. 21 Jul. 2016. http://www.nytimes.com/2016/07/22/upshot/what-donald-trump-doesnt-understand-about-the-trade-deficit.html?_r=1Jacobson, Louis. “A closer look at Donald Trump’s comments about refinancing U.S. debt.” Politifact. 16 May 2016. http://www.politifact.com/truth-o-meter/article/2016/may/16/closer-look-donald-trumps-comments-about-refinanci/Johnson, Jenna. “Donald Trump is expanding his Muslim ban, not rolling it back.” The Washington Post. 24 Jul. 2016. https://www.washingtonpost.com/news/post-politics/wp/2016/07/24/donald-trump-is-expanding-his-muslim-ban-not-rolling-it-back/Jubera, Drew. “How Donald Trump Destroyed a Football League.” Esquire. 13 Jan. 2016. http://www.esquire.com/news-politics/a41135/donald-trump-usfl/Kruse, Michael. “The Man Who Beat Donald Trump.” Politico. 25 Apr. 2016. http://www.politico.com/magazine/story/2016/04/donald-trump-marvin-roffman-casino-lawsuit-213855Marans, Daniel. “Trump Opposes Cutting Social Security From A ‘Moral Standpoint’.” The Huffington Post. 31 May 2016. http://www.huffingtonpost.com/entry/donald-trump-supports-cutting-social-security-report-says_us_5749db63e4b0dacf7ad515e4Nelson, Louis. “Trump: ‘I’m the king of debt.’” Politico. 22 Jun. 2016. http://www.politico.com/story/2016/06/trump-king-of-debt-224642Onaran, Yalman. “A U.S. Default Seen as Catastrophe Dwarfing Lehman’s Fall.” Bloomberg. 7 Oct. 2013. http://www.bloomberg.com/news/articles/2013-10-07/a-u-s-default-seen-as-catastrophe-dwarfing-lehman-s-fallQiu, Linda. “Donald Trump’s absurd claim that he knows nothing about former KKK leader David Duke.” Politifact. 2 Mar. 2016. http://www.politifact.com/truth-o-meter/statements/2016/mar/02/donald-trump/trumps-absurd-claim-he-knows-nothing-about-former-/Qiu, Linda. “Yep, Donald Trump’s companies have declared bankruptcy…more than four times.” Politifact. 21 Jun. 2016. http://www.politifact.com/truth-o-meter/statements/2016/jun/21/hillary-clinton/yep-donald-trumps-companies-have-declared-bankrupt/Shafer, Jack. “Donald Trump Talks Like a Third Grader.” Politico. 13 Aug. 2015. http://www.politico.com/magazine/story/2015/08/donald-trump-talks-like-a-third-grader-121340Smith, Elliot Blair. “How Donald Trump left $13 billion on table.” Marketwatch. 1 Mar. 2016. http://www.marketwatch.com/story/how-donald-trump-left-13-billion-on-table-2016-03-01Stuart, Tessa. “Donald Trump’s 13 Biggest Business Failures.” Rolling Stone. 14 Mar. 2016. http://www.rollingstone.com/politics/news/donald-trumps-13-biggest-business-failures-20160314Wolfers, Justin. “Debate Night Message: The Markets Are Afraid of Donald Trump.” The New York Times. 30 Sep. 2016. http://www.nytimes.com/2016/10/02/upshot/debate-night-message-the-markets-are-afraid-of-donald-trump.html?_r=1Ye Hee Lee, Michelle. “Donald Trump’s false comments connecting Mexican immigrants and crime.” The Washington Post. 8 Jul. 2015. https://www.washingtonpost.com/news/fact-checker/wp/2015/07/08/donald-trumps-false-comments-connecting-mexican-immigrants-and-crime/Zandi, Mark, et. al. “The Macroeconomic Consequences of Mr. Trump’s Economic Policies.” Moody’s Analytics. 17 Jun. 2016. https://www.economy.com/mark-zandi/documents/2016-06-17-Trumps-Economic-Policies.pdfZarroli, Jim. “Trump Favors Returning To The Gold Standard, Few Economists Agree.” NPR. 16 Jun. 2016. http://www.npr.org/2016/06/16/482279689/trump-favors-returning-to-the-gold-standard-few-economists-agree
By Anthony Campano
Saving is a practice often preached to young adults who have just entered the workforce, yet pushed aside in certain occasions, such as moving out of your parents’ house or buying a new car. However, CNBC released a statistic that should strike you as remarkable: “47 percent of Americans said they could not afford an emergency expense of $400.” Living outside of our means is a major problem in America, and we as a country should be trying to resolve the situation with much more enthusiasm than we are.A number of rich countries--most notably Japan--are starting to experience economic woes associated with the aging of the population. For America, this problem is on its way, albeit in the form of an entitlement crisis. With almost half of the country saving nearly nothing for their retirement costs, Social Security is predicted to spend even more money than it will bring in (it already does this today). The baby-boom generation is growing closer to retirement, and with the threat of more people being out of the workforce than in it, an enormous decision will have to be made on what to do about Social Security. At the microeconomic level, households will grapple with greater dependency burdens.The burden will be felt by yours truly, the future American taxpayer from the X and the Millennial generations. Therefore, our generation will face the task of correcting this problem. Do we blame the older population for not saving, or do we “take one for the team” and pay substantially higher tax rates? This issue is in no way black or white, as there are many reasons as to why the older generations have little to none in their savings account. First off, that 47% is four percent more than the amount of people that live paycheck-to-paycheck. The key fact cited in defense of these lower-middle class citizens is the ‘starvation’ wage of $7.25 an hour. Is this a wage that is sufficient enough to save the recommended slightest amount of 10% off of every payday? Second, in an argument provided by Forbes, “Social Security is the only government-sponsored inflation-adjusted retirement payment for life. Ask your employer if they will convert your 401(k) to a guaranteed, life-time inflation-indexed annuity. After the laughing stops, you’ll have a different attitude about Social Security.” By not allowing workers to take advantage of the Social Security perks, you are putting their retirement plans into the hands of the CEO. For example, Wal-Mart--America’s biggest employer--is considered to only focus on excessive profit maximization, not the economic welfare of their low wage workers, who have no education and no one else looking out for their financial stability. From the other standpoint, why should it be on us to pay for the financial burdens of older generations? Was it us who were poorly saving or investing in unaffordable houses? No, but the moral of the story is that we must abandon these financial habits of the previous generations, and figure out how to handle the mess. How we, the millions of young adults today, decide to handle these challenges will shape our way of life, and most likely set the standards for financial sustainability for generations to come. We cannot take this choice lightly.Sources:http://www.pbs.org/newshour/making-sense/can-you-guess-how-many-americans-have-absolutely-no-savings-at-all/http://fivethirtyeight.com/features/what-baby-boomers-retirement-means-for-the-u-s-economy/http://www.cnbc.com/2016/06/21/66-million-americans-have-no-emergency-savings.html
By Pete Scharf
“Decades of record immigration have produced lower wages and higher unemployment for our citizens. We are going to have an immigration system that works, but one that works for the American people.” - Donald Trump, RNC acceptance speech[1]Throughout his presidential campaign, Republican nominee Donald Trump has accused immigrants of bringing crime, suppressing wages, and abusing our welfare system. In Europe, the fear of immigration’s negative consequences has propelled far right anti-immigration parties to victory in Switzerland[2], France[3], and Poland[4], among others, and indeed was the main contributor to the UK’s decision to leave the European Union. The perceived negative economic impacts are keeping even more left-leaning politicians like Bernie Sanders skeptical of immigration.[5] Although there may be some legitimate arguments against immigration from a national security standpoint, the economic argument is strongly in favor. Immigration, for the most part, does not depress wages, hamper growth, or create unemployment. Instead, immigration is a sign of a healthy economy and is a benefit both to the immigrants seeking a better life and to the native worker.The idea of wage suppression is a common argument against increased immigration. The Trump campaign claims their restrictive immigration policy will boost native wages, and the argument goes like this: immigration shifts the labor supply curve to the right, which leads to a drop in equilibrium price of labor, leaving all workers with lower wages. This line of reasoning, however, entirely ignores the demand-side effects of immigration. Immigrants who come here to make money also go out and spend it, thus creating demand and often more than offsetting the increase in supply. Foged and Peri (2013) studied the wage of unskilled Danish workers and found that increases in the labor force caused by immigration actually raised the wages of unskilled native workers.[6] Similar studies have found small positive results on native wages with at most minor negative changes to unskilled workers. As shown in the table below, a study by the Economic Policy Institute found the only decrease in wages occurred for foreign workers who had to compete directly with new immigrants. Native workers’ wages remained nearly unchanged, and at times enjoyed small positive effects.[7]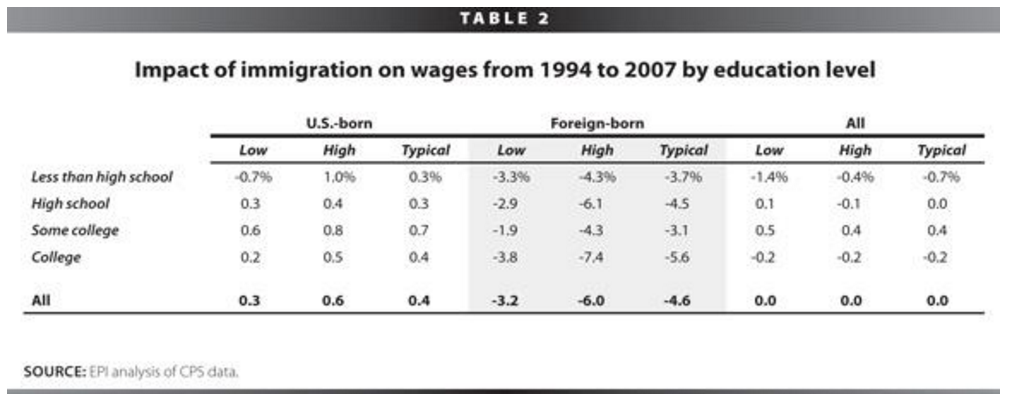 Negative wage impacts primarily occur for foreign born workers who directly compete against newer immigrants. U.S.-born workers’ wages remained almost unchanged with slight positive effects.[7]A second malady blamed on immigrants is unemployment. Critics argue that immigrants coming into the country compete for jobs U.S. workers currently hold, and are willing to take them at lower wages, leading to unemployment among native workers. Empirically, however, this has simply not been the case. Islam (2013) found no effect of immigration on unemployment.[8] In fact, the opposite was true: lower unemployment increased immigration. A lower unemployment rate was a signal of a healthy labor market that would attract immigrants. In times of high unemployment, immigration waned only to pick back up again when the labor market turned around.
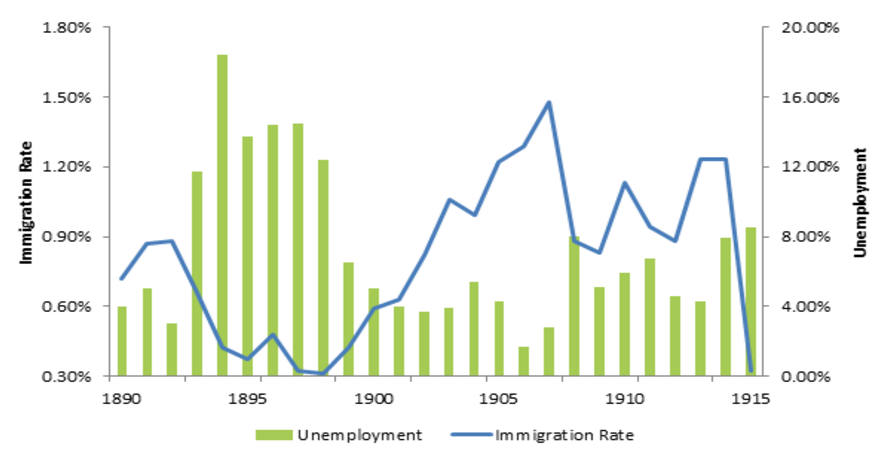 Immigration and unemployment during a period of heavy immigration (1890-1915). The drop in immigration in 1914 is attributed to World War I.[9]Lastly, many assume immigration has a negative impact on the welfare programs in the United States. They claim immigrants utilize our public assistance programs without contributing equal amounts in taxes, which either raises taxes on U.S. citizens or causes the financial ruin of these programs. In reality, the federal government does not allow this to occur: “With many important exceptions, Qualified Aliens are ineligible for the Supplemental Nutrition Assistance Program (SNAP formerly the Food Stamp Program) and SSI. States have the authority to determine their eligibility for TANF, SSBG, and Medicaid. With some exceptions, Qualified Aliens entering the country after August 22, 1996, are denied Federal means-tested public benefits for their first five years in the U.S. as qualified aliens.”[10] A Harvard study looking at Medicare, a program immigrants can utilize under certain circumstances, found “immigrants made 14.7 percent of Trust Fund contributions but accounted for only 7.9 percent of its expenditures—a net surplus of $13.8 billion. In contrast, US-born people generated a $30.9 billion deficit.”[11] The policy and the research suggest that if anything, immigrants put more into welfare programs than they take out.While immigrants are a source of cash flows to the federal government, they may constitute a fiscal burden for state and local governments. This is primarily because immigrants are poorer on average than U.S.-born taxpayers, and thus foot a smaller tax bill. A National Research Council study concluded that although immigrants are a fiscal positive to the federal government of about $105,000 over the course of their lifetime, they are a fiscal negative for state governments to the tune of $25,000.[12] However, the loss by state governments could be completely eliminated by the immigrants’ positive macroeconomic impact.The research is clear: the benefits of immigration greatly outweigh its small risks and miniscule negative consequences. Politicians often wrongfully paint immigrants as leeches wishing to enter our country to steal our jobs, lower our wages, and drain our welfare resources; these claims run counter to most economic evidence. We need to support candidates and policies that further liberalize immigration, not hamper it. When an immigrant comes to the United States, they not only better their own life, but the lives of their American neighbors.The Experts Agree
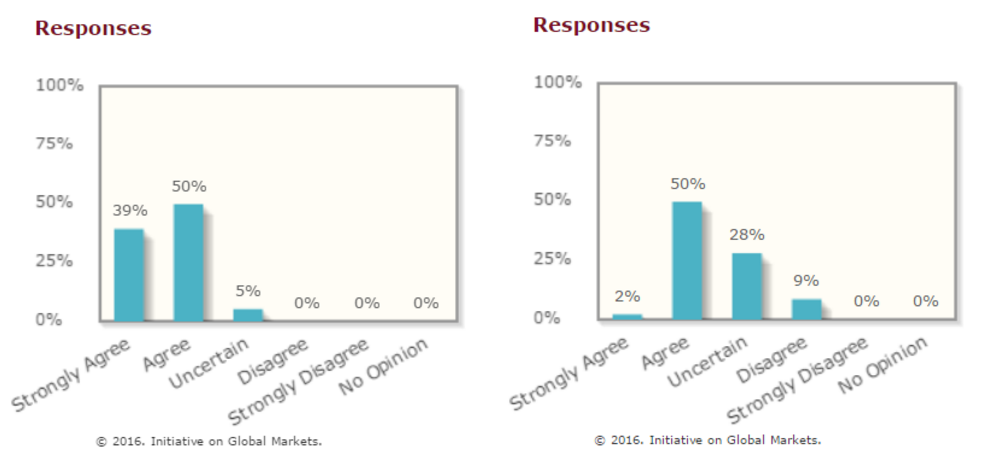 Courtesy of the IGM Economic Experts Panel.Left Chart: “The average U.S. citizen would be better off if a larger number of highly educated foreign workers were legally allowed to immigrate to the U.S. each year.”[14]Right Chart: “The average U.S. citizen would be better off if a larger number of low-skilled foreign workers were legally allowed to enter the U.S. each year.”[13]Further Reading:Trillion-Dollar Bills on the SidewalkThe Case for Open BordersTen Economic Facts About Immigration16 Reasons Why Opening Our Borders Makes More Sense Than Militarizing Them
By Eleanor Tsai
Few issues are as loaded as gun control is in the United States today. Each mass shooting--frighteningly frequent within the past five years--is as divisive as it is painful: what can and should the government do to prevent deaths at the hands of would-be gunmen?Those on the left make impassioned calls on Congress to pass stricter laws regulating who can own guns. Among other proposals, they favor assault weapons bans and expanding and mandating background checks that would make it more difficult to buy weapons in the first place. Everyone is safer when there are fewer guns on the streets, the argument goes. Those on the right insist such restrictions would infringe on the Second Amendment rights of law-abiding gun owners, without commensurate efficacy in stopping gun violence. They point to the fact that killers often acquire their weapons illegally, rather than legally, and refer to a long-standing claim that more guns deters crime. In the words of Wayne LaPierre, the CEO and Executive Vice President of the National Rifle Association, “The only thing that stops a bad guy with a gun is a good guy with a gun.”Wayne LaPierre’s reasoning appeals to the old economic fallback of cost-benefit analysis. It suggests if a gunman believes he is able to act before law enforcement can respond or punish him, the risk and hence expected cost of the crime to him is lower relative to his payoff. However, if everyone else were to carry guns and be able to retaliate against him immediately after he opened fire, the risk of dying in the act would increase; and anticipating this, he would be more likely to refrain from shooting. Generalizing beyond the potential shooter implies game theoretic behavior--each person decides whether or not to carry a gun based on whether or not those around them do. If one person buys a gun, the others become vulnerable unless they, too, take up guns to signal they are credible threats and keep him from shooting. In equilibrium, no one will own a gun, or everyone will. The same logic has been applied in international relations theory to explain arms races between countries.It is hard to refute that a world without weapons is safer than a world in which everyone owns them. After all, even if all gun owners were mentally stable “good guys,” accidents could set off deadly shootings. But the reality is not, in fact, dichotomous; blanket assault weapons bans have been politically unfeasible, so across the country there are people who own guns and people who do not, and the prevalence of gun ownership varies considerably by community. While it is intuitive that in this case government regulation should focus on identifying and targeting likely killers, there are no “one-size-fits-all” policy prescriptions due to location-specific factors. For example, states have differentially adopted “shall-issue” laws, which stipulate that they must grant gun owners licenses to carry concealed weapons, as long as certain criteria are met (that is, no justification is required).Heterogeneity begs an examination of the empirical relationships between gun ownership, concealed carry, and public safety. Two papers have studied these issues directly: Duggan (2000) and Ayres and Donohue (2002). Duggan (2002) finds “increases in gun ownership lead to substantial increases in the overall homicide rate,” but have small or statistically insignificant effects on other types of crimes. Ayres and Donohue (2002) assert, “No longer can any plausible case be made on statistical grounds that shall-issue laws are likely to reduce crime for all or even most states.” What do you think? Given the theory and the data, should the United States increase limits on gun ownership? If so, how might shall-issue and other existing laws be reformed to draw closer to a social optimum that balances public safety with civil liberties?Further reading:CNN: Senate Rejects Gun Control MeasuresWashington Post: The Economics of Gun ControlCQ Researcher: Should Lawmakers Tighten Firearm Restrictions?The Social Cost of Gun Ownership (Cook & Ludwig, 2006)A Game Theoretic Model of Gun Control (Taylor, 1993)
By Eric Richman
Since we’re currently living in a period of economic recovery, it would be wise to reflect on the recent economic recession. Consumers tend to become more frugal with their dollars during periods of recession, so it is interesting to see what they will and will not spend their money on. Some purchasing trends are more intuitive than others: for example, we’d expect people to eat at home more often than out at restaurants. An intuitive trend from the Great Recession that is represented in the table below is consumer vehicle purchasing before, during and after the recession. There is clearly a sharp decline in new vehicle purchases and a modest rise in used vehicle purchases.
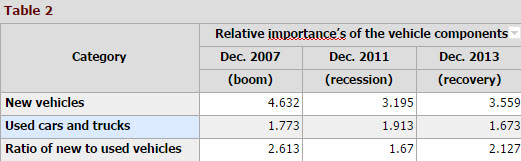
This is expected during hard economic times, as people cannot afford to buy a brand new vehicle and must settle for older more affordable vehicles. Along with decreasing new vehicle purchases, another expected trend is decreasing amount of homeownerships and an increase in renting. According to April’s 2009 trendswatching report, the recession created a consumer which the report dubbed ‘Sellsumers’. These consumers have become particularly creative in finding ways to sell extra space or services, for instance renting homes or parking, reselling unwanted items, and many more creative ways.
A trend that is not as intuitive as increased renting opportunities is what happened to airline fare. One would expect travel to decline resulting in decreasing airfare purchases, yet this was not the case. The table below shows that the index for airline fair rose highest during the recession and now has decreased during the recovery. This is counterintuitive as the table also shows the importance of hotels and motel rising from the recession to the recovery, which should result in airline fare rising as well. This could be a result of people in the recovery period looking for less expensive ways to travel, in order to save money to travel more. Whatever the reason is the airfare industry did not see a decline like many other industries did.
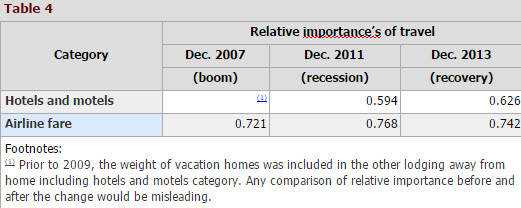
A second less intuitive trend during the Great Recession was an increase in matchmaking services. According to a February 2009 article in the New York Times, “Online and offline matchmakers are reporting that dating interest is up, way up.” The article goes on to state that Match.com had one of its strongest quarters in the past seven years. It even states brick-and-mortar matchmaking services in cities like New York, Los Angeles, and Miami were up 40% among women in early 2009. There are a variety of possible reasons for this increase in matchmaking services, yet the most sensible is that with more people facing hard financial times they would rather have someone to be with than face it alone. More people are staying home to save and online looking for someone to meet.

As well as matchmaking services, another less intuitive industry that typically will see an increase in business is the sin industries. People will buy a bottle of wine or a pack of cigarettes to help cope with the malaise that generally comes to consumers during a recession. One of the services in the sin industry that does not do as well as some of its counterparts is gambling. Usually the products and services in the sin industry that give small pleasures and are less expensive can be found to do well. Gambling on the other hand is found to be a luxury not many will dare to afford during a recession. On the contrary, gambling usually does its best whenever the economy is booming. Since people lean towards staying home when money becomes tight, they also lean towards finding low-cost entertainment to keep them busy while at home. Many turned to online gaming that is at sometimes free and is easily accessible to millions of users at a time. People now given more leisure time will also arrange to watch their favorite TV shows and movies, increasing the use of sites like Hulu and Netflix. It will be rather interesting to see whether some of these services can maintain their recession time numbers and which ones will falter during the economic recovery. With people gaining lost purchasing power it will be fascinating to see if they will be more cautious in their spending now during the recovery, since they have seen how hard times can get. Sourceshttp://www.nytimes.com/2009/02/12/fashion/12dating.html?_r=0http://memesponge.com/2009/06/top-10-emerging-consumer-behavior-trends-in-recession/http://www.investopedia.com/articles/stocks/08/industries-thrive-on-recession.asp
By Trevor Baumgartner
A Brief Introduction to CartelsOn September 20, 2012, the United States Department of Justice fined AU Optronics, a Taiwanese LCD manufacturer, $500 million for their participation in a price-fixing scheme--the largest single fine imposed on a firm for violating anti-competitive laws. This landmark sentencing was the result of an ongoing investigation into the LCD cartel, which has thus far resulted in $1.39 billion in criminal fines as well as jail sentences for 12 executives at the eight firms in question. Fines imposed by the European Commission for European commerce affected by the cartel are shown in Figure 1 below. Historically speaking, cartels have been present in a wide range of industries, with heavy concentration in the vitamins, auto parts, and electronics industries. Oligopolistic industries in which firms produce goods with little to no product differentiation are especially susceptible to cartel formation. If firms are unable to differentiate their product, the price of the product is driven down to a point near the marginal cost of production. Collusion then seems a natural solution for firms to ensure a favorable profit margin that would otherwise not be achievable. Cartel formation allows firms to function as a monopoly in their respective industry--giving them collective bargaining power in terms of uniformly raising prices or restricting output, or both. The large fines imposed on firms participating in cartels are a testament to the extent to which cartel activity disrupts pure market competition, and therefore warrants government enforcement. We seek to analyze the impacts and efficacy of government antitrust policy in an effort to determine what existing incentives remain for firms to collude.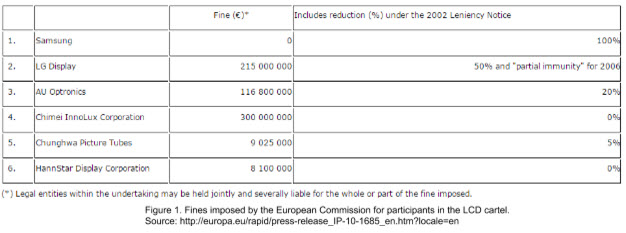 Leniency PolicyGovernment scrutiny of anticompetitive practices dates back to the passing of the Sherman Antitrust Act in 1890. Under the Sherman Antitrust Act, any contract or conspiracy in restraint of free trade was declared illegal, and those in violation of the act were subject to heavy fines or jail time. Public response to the act was mixed, with those in favor arguing that it protected consumer surplus by preventing monopolies from raising prices and thereby ensuring pure competition between firms. Those against argued that the act was in violation of the free market and ultimately failed in its intent to prevent unfair pricing by reducing economies of scale.On August 10, 1993, the United States Department of Justice (DOJ) adopted new legislation known as the Corporate Leniency Policy. Prior to this legislation, leniency (or partial leniency) was granted on a discretionary basis for firms that aided the DOJ in cartel investigations. Under the new guidelines, amnesty is automatically granted to the first firm to admit to cartel involvement and provide information to strengthen the DOJ’s investigation, granted that the firm meets certain conditions. Amnesty is granted provided that (1) the DOJ does not already have an ongoing investigation into the cartel, (2) the corporation seeking amnesty took prompt action to terminate cartel activity, (3) the corporation fully complies with the DOJ and provides valuable information about the cartel, (4) the confession is a corporate act and not an isolated confession, (5) the corporation makes restitution where possible, and (6) the corporation was not the ringleader of the cartel. This Amnesty Policy was the result of concerns that current antitrust legislation was not having strong enough deterrent effects. The intent of the new legislation was to destabilize cartel activity by causing distrust in existing cartels and deterring cartels from forming in industries susceptible to such activity.Following the Department of Justice’s lead, the European Commission adopted similar legislation on February 19, 2002. The conditions for amnesty under the European Commission are similar to those of the Department of Justice, with the major difference being that the European Commission will grant amnesty to the ringleader of the cartel under certain conditions.Evaluating LeniencyEffective deterrent policy should have dual effect of (1) causing formidable distrust in existing cartels and (2) raising the expected losses from indictment to a level that exceeds expected profits. With regard to creating distrust in existing cartels, corporate leniency functions by offering huge incentives to the first--and only the first--firm to come forth with information regarding cartel activity. As long as the leniency seeker meets the necessary criteria, they avoid both fines and possible jail time, while the other firms incur massive damages. Firms participating in cartels are cooperating only because price-fixing enhances their individual profits, which suggests a lack of true loyalty between firms. In other words, this winner-takes-all approach should theoretically create a sufficient level of distrust among firms in existing cartels. Scott D. Hammond of the US Department of Justice notes in a 2001 press release that, “Over the last five years, the Amnesty Program has been responsible for detecting and prosecuting more antitrust violations than all of our search warrants, consensual-monitored audio or video tapes, and cooperating informants combined. It is, unquestionably, the single greatest investigative tool available to anti-cartel enforcers. Since we expanded our Amnesty Program in 1993, there has been more than a ten-fold increase in amnesty applications.” Furthermore, the cooperation of a leniency applicant has made the process of prosecuting cartels far more efficient. The problem with evaluating the effectiveness of the corporate leniency policy lies in only being able to draw inferences based on observed cartel activity (Zhou, 2). If undetected cartels function in a more sophisticated manner, the observed sample will be misrepresentative of cartel activity as a whole.Ultimately, the more important focus of antitrust enforcement should be preventing cartels from forming in the future. Consider a bank robber that stands to gain $50,000 from robbing a bank and risks $80,000 in fines if he is caught. If the robber anticipates only a 50% chance of being caught, then his expected losses are only $40,000 when weighed against the probability of getting caught. Thus expected profit exceeds expected losses, and committing the crime remains a rational strategy for him. Economic theory suggests that the same logic holds for firms considering collusion. In this light, research suggests that cartel sanctions are not at an optimal level. Research has shown that when weighing expected profits against expected losses for a sample of 75 cartels prosecuted in the Unites States, sanctions are only 9% to 21% as high as they should be to optimally prevent cartels from forming (Connor & Lande, 428). Fines from prosecution are calculated based on the estimated increase in revenue resulting from price-fixing, so if a cartel remains confident that they will go unnoticed, then expected profits will still exceed expected losses. That being said, the Department of Justice remains confident that the increase in both fines and jail time for convicted cartels and individuals over the past few decades is an indicator that antitrust policy is moving in the right direction (see figure 2 below). It remains unclear whether the increase in the number of cases being prosecuted corresponds to less cartel activity in general, or simply means cartel activity is much larger than previously imagined. The difficulty in discerning how many cartels continue to form despite deterrent policy leaves this question unanswered.
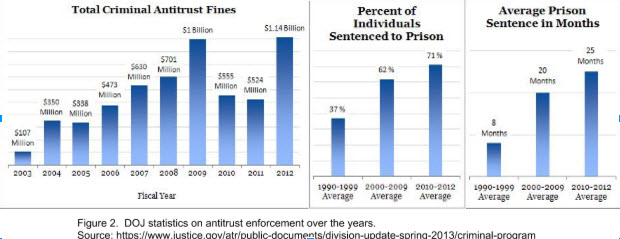 In conclusion, while corporate leniency has resulted in increased prosecution, fines, and jail time, it remains unclear as to whether sanctions are at a sufficiently optimal level to deter firms in industries susceptible to cartel activity from forming cartels. The worrying statistic is the amount of cartels that have continued to form in spite of the Corporate Leniency Policy, and the number of large corporations that have participated in multiple cartels over the last few decades. Cartel recidivism is a clear indicator that incentives still exist for firms to risk heavy fines and jail time by colluding. The Corporate Leniency Policy, while certainly a beneficial tool in creating instability in cartels and aiding in prosecution, is not a panacea to worldwide anti-competitive collusion.
By Steve Leonard
Before reading on, it should be noted that I write this article from a neutral point of view. As I sit, I feel particularly jaded when it comes to college, as most seniors probably do. From these feelings come thoughts of the alternatives I could have picked four long years ago instead of going to college such as selecting a blue collar job like becoming an electrician. Out of curiosity I decided to make a few simple assumptions to determine if getting a degree is really more advantageous than working a blue collar job when it comes to retirement. We’ll pretend life begins at retirement then, and he who has the most saved at age 65 is the winner. We’ll need to make a few more assumptions to simplify this scenario enough to come to a conclusion.The first assumption will be that retirement contributions towards a 401k are 10% of salary. Salaries used will be $31,969 for a blue collar job, which is the average salary for an entry level electrician , and $45,327 for those with a bachelor’s degree, which is the average salary for a new college graduate. Savings work out to be $3,196 for a blue collar job and $4,532 for those with a bachelor’s degree. The second assumption will be that savings for retirement begin at age 18 for a blue collar job and at age 28 for those with a bachelor’s degree. While most people graduate at age 22, we’ll assume that savings won’t begin until age 28 to account for student loan debt. If graduates contribute $4,532 per year to a 401k and average student loan debt was $29,000 in 2012, we’ll assume those 6 years of would-be retirement savings are used to pay off debts instead. Third, we’ll assume the average retirement age is 65. The last assumption we’ll make is that the average rate of growth for a 401k is 5%.Under these assumptions, a blue collar worker who contributes $3,196 per year for 47 years earning 5% would have $569,269. Those with a bachelor’s degree contributing $4,532 per year for 37 years earning 5% would have $460,578. That’s a difference of $108,691. An electrician earns $108,691 more in retirement savings over their career than those who have earned a bachelor’s degree. In fact, someone with a bachelor’s degree would have to retire at age 68 if they wanted to have the same amount saved as an electrician who retired at age 65.I recognize that the assumptions made here simplify this complicated scenario to a great extent. I also recognize that those who attend college have higher lifetime earnings potential than those with blue collar jobs. However, there are many jobs that require degrees such as elementary education jobs where lifetime earnings are nearly on par with that of blue collar jobs.In the end, there is no right or wrong answer to whether college is worth it. Aside from a retirement standpoint, there are many other ways in which individuals gain value from going to college and there are many other ways in which individuals place value on not going to college. When it comes to retirement though, some blue collar jobs do in fact come out on top. And even for those blue collar jobs that may not come out on top, the retirement savings difference between college graduates and their counterparts may not be as large as some people imagine. For me, going to college was definitely a decision I’m glad I made, but I was certainly surprised to see how retirement savings can stack up against those who chose not to make the same decision I did.Sources:http://www.forbes.com/sites/kerryhannon/2013/01/13/the-three-surprises-in-401ks/#16b0c4c932eahttp://naceweb.org/salary-resources/starting-salaries.aspxhttp://ticas.org/sites/default/files/pub_files/Debt_Facts_and_Sources.pdfhttp://www.hamiltonproject.org/papers/major_decisions_what_graduates_earn_over_their_lifetimes/http://www.bls.gov/oes/current/oes472111.htm
By Joe Kearns
Africa has long been, and largely still is, avoided like the plague by investors from developed economies due to concerns over government corruption, war, and poor infrastructure. It shouldn’t be. Though declining commodity prices, China’s economic downturn, and policy failures have eroded investor confidence in Africa, the International Monetary Fund (IMF) projects the continent’s economic growth to reach 4% in 2016, a modest increase from 3.5% in 2015. In contrast, 2015 World GDP growth was -0.4% and U.S. GDP growth was 0.0%. The rational action for investors in developed economies searching for positive returns is to jump on a largely untapped opportunity to invest in Africa and go against the conventional bearish sentiment.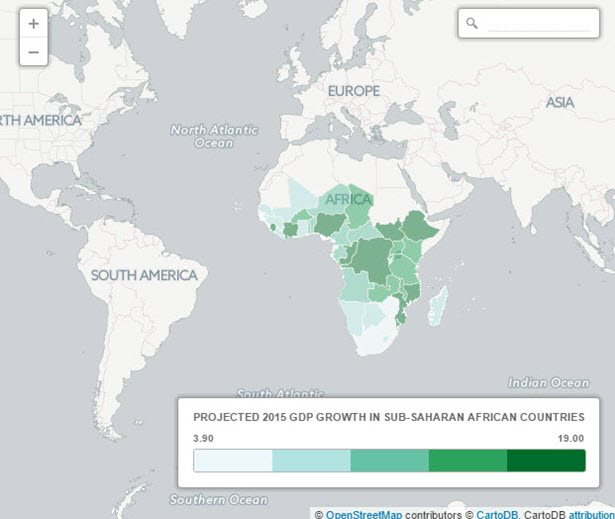 The bedrock assumption of classical economics that individuals make rational choices is challenged by a concept in international finance called the equity home bias puzzle. Financial economist Kenneth French and public economist James Poterba wrote in “Investor Diversification and International Equity Markets” (1991) that individuals and institutions in most countries predominantly hold domestic equity and only a marginal amount of foreign equity. According to French and Poterba, at “the end of 1989, Japanese investors had only 1.9% of their equity in foreign stocks, while U.S. investors held 6.2% of their equity portfolio overseas.” In December 2014, David Snowball, publisher of the Mutual Fund Observer newsletter, estimated that just 0.3% of the average portfolio in the United States, or $3 of every $1000, is invested in African assets.It is true that many African investments have not fared well recently. Nigeria’s stock market index is down by 16% since the start of 2016. The S&P Zambia Index plunged 45% and its currency, the kwacha, depreciated by 45% relative to the dollar in one year. Ghana became mired in an economic crisis and had to pay a steep 10.75% interest rate for $1 billion in Eurobond. But even amidst unfavorable economic circumstances, the Ivory Coast stock exchange gained 7% in 2015 and the Kenyan stock exchange has been in the black since January. Both the Ivory Coast and Kenya are energy importers that benefit from the very phenomena which hurt economies like Angola, Nigeria, and Equatorial Guinea for whom 90% of export revenue is accounted for by oil.It hardly seems rational for investors—even risk-averse investors—to invest so little in such a promising opportunity. It is best not to look at Africa as a monolithic entity, but a variety of economies with their own unique investment opportunities that fare differently over time. There are several reasons to remain optimistic about the future of Africa and the recent dip in African stocks and currencies means now is an excellent time to join the party.Why Will African Economies Outperform the Developed World?Demographics suggest that Africa is attaining a labor market which is conducive to strong economic growth. Africa has the youngest population in the world with 200 million people aged between 15 and 24. According to the United Nations, this figure will double to 400 million people by 2045.It should be stressed that the economic situation is far from completely rosy in Africa. Six of the ten fastest growing economies in the world are in Sub-Saharan Africa, but the unemployment rate for the region is 6%. The African Development Bank (AfDB) reports that regional youth unemployment is twice as high as the general unemployment rate. North Africa especially suffers from high youth unemployment with a youth unemployment rate at 30%. Botswana, the Republic of the Congo, Senegal, and South Africa are among the countries which fare even worse than that region.Nevertheless, Marketwatch reporter Sara Sjolin conveyed a valid reason to believe the labor market will improve: “In the strongest African economies, as the workforce expands, economists expect demographics to drive higher demand for services, goods, housing and infrastructure, which in turn will help drive domestic economies.”To make this happen, African policymakers need to shift government spending towards facilitating growth in sectors like agriculture and manufacturing. Thomas Vester, manager of $875 million at the LGM Frontier Markets fund, credited Kenya, Ghana, Botswana, and Zambia as countries which have recently committed to longer-term projects like infrastructure and housing construction to support sectors with strong future growth. Vester forecasts that these economies will experience a 20-year trend of growth of about 6%-7% due to the fiscal stimulus. African policymakers have recognized that the optimal role of government is to intervene to facilitate economic growth and are slowly beginning to reap the rewards.Most importantly, data suggests that Africa is undergoing a transformative moment in its economic history. The natural resources and mining sectors have been the fastest-growing sectors for years in Africa, but Sjolin argues, “With rapid economic growth also comes a rising middle class that wants to go out, open bank accounts, buy branded groceries and, eventually, buy cars, houses and life insurance.” The biggest African economy, Nigeria, saw its middle class grow by 600% between 2000 and 2014. Sjolin also believes that by 2030 Ghana, Angola, and Sudan will experience a steep increase in middle-class families as well.The growth of a large middle class will be vital for African economic growth. Middle class consumers have a high marginal propensity to consume relative to their upper class counterparts, but also more disposable income than the poor. For this reason, the forecast of a substantially expanded middle class is the biggest reason to be optimistic about African economic growth.What Are The Best Investment Opportunities in Africa?The question for investors is who benefits from the consumption patterns of the new African middle class. Vester indicates that these middle-class consumers are likely to boost profitability for telecom companies, food and beverage companies, and banks. His fund has holdings in companies like the Guaranty Trust Bank in Nigeria and Senegalese telecom provider Sonatel. Meanwhile, Mark Mobius, executive chairman of Templeton Emerging Markets Group and manager of the Templeton Africa Fund, owns holdings Guaranty Trust Bank as well, along with Zenith Bank (Nigeria), Nigerian Breweries (Nigeria), and telecom firm MTN Group (South Africa).Vester and Mobius, however, entered into long positions with these firms at the end of 2014, prior to the volatility of 2015 and the asset market plunge in 2016. Consequently, the stock prices for companies have recently plummeted as shown below:Guaranty Trust Bank PLC
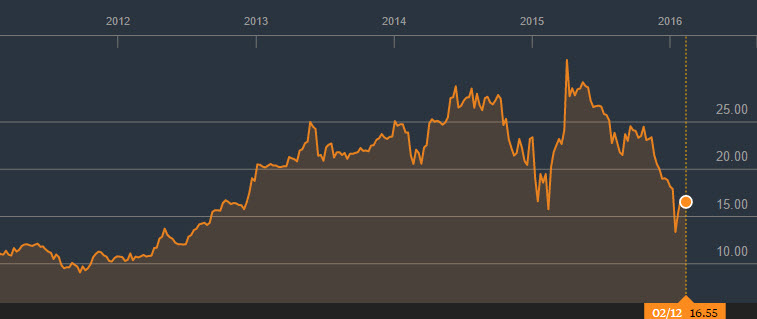 Zenith Bank PLC
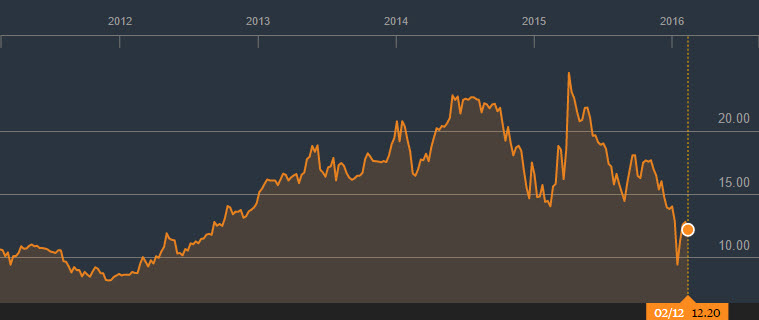 Nigerian Breweries PLC
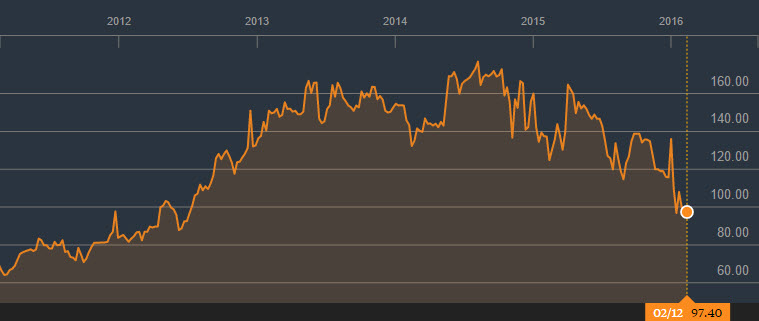 MTN Group PLC
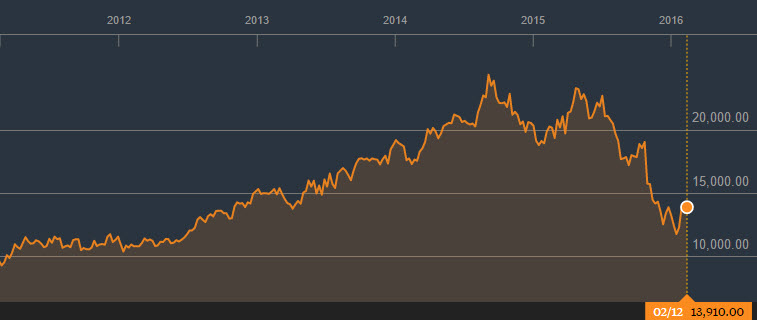 These companies have seen sharp dips in their market value in the past year, but there are reasons to be confident in their fundamentals.
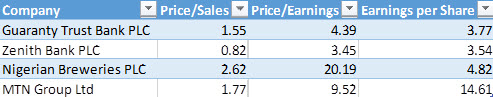 This small sample shows that it is reasonable to believe that there are long-term opportunities to invest in Africa and earn a high return. Though investors are afraid of the macroeconomic outlook in the short term, financial analysis of these companies indicates these fears are misdirected. The relatively high earnings per share, along with the relatively low price/sales and price/earnings (Nigerian Breweries PLC excepted for the P/E pattern), indicates that African companies can be solid bargains.With that being said, it is rational for short-term investors to have some anxiety. Like many frontier markets, African economies have struggled because of monetary policy divergence with the Federal Reserve Bank of the United States which has begun to raise its benchmark interest rate. More significantly, however, many African economies are dependent on exporting commodities like brent crude, foods, and metals. For instance, Nigeria’s net exports of commodities consist of 34.5% of its GDP.
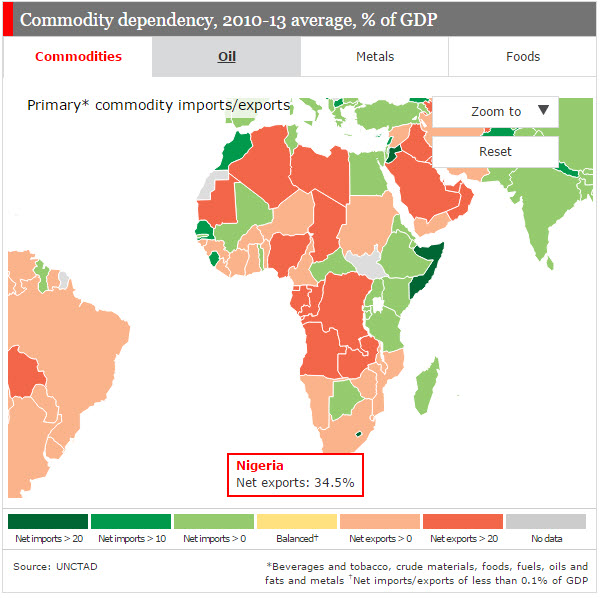 For the time being, many African countries—especially the ones shaded in dark red on the graphic from The Economist shown above—are vulnerable to price swings of commodities like the drop in brent crude from $104.90 to its current level of $32.70. But given the fact that African governments have begun to diversify their economies, it is reasonable to believe that the woes of African stocks are transitory. If the map above looks much different in twenty years as I suspect, that means assets in Africa will have increased in value exponentially from where they are now. It is a risk to make that assumption, but I believe it is a well-calculated risk.The FutureThe long-term potential of African economic growth has created an excellent opportunity to exploit the risk aversion of other investors. There are short-term pains now, but it is best to follow the advice of Laura Garitz, manager of the U.S.-based Wasatch Frontier Emerging Small Countries fund. One quarter of her fund’s assets are invested in Africa and she has made no reductions this year. “Africa’s countries can no longer depend on a booming export market for resources to China,” Ms. Geritz said to The Wall Street Journal. “Africa will have to depend on its greatest asset—it’s pool of young, bright, driven people.”Moreover, the equity home bias puzzle demonstrates the validity of contributions from behavioral finance. There are not many fundamental reasons investors should allocate almost all of their assets in their home country, which creates an opportunity for risk-seeking investors willing to look elsewhere. Data indicates that Africa is clearly the best region for these investors to earn a high return. By continuing to miss out on the vast economic growth from the continent, developed market investors are leaving easy money on the table. Simply put, it pays to not always root for the home team.Author's Note: As always, this post reflects solely my own views, not those of the Penn State Economics Association or any other entity I represent.
By Joe Kearns
It is no secret that former U.S. Secretary of State Hillary Clinton, like her husband Bill, has Wall Street’s ear. She has built personal relationships with prominent banking executives like Goldman Sachs CEO Lloyd Blankfein, Morgan Stanley CEO James Gorman, JPMorgan Chase CEO Jamie Dimon, and Bank of America Merrill Lynch CEO Brian Moynihan. This outreach to Wall Street executives and their employees is particularly useful to Clinton in fundraising for the 2016 presidential campaign. “The money is already behind her,” a Wall Street money manager told Politico. “I don’t think it’s starting to line up behind her: It’s there for her if she wants it.”Like her establishment Republican counterparts, Clinton faces an opposition characterized by distrust of political elites. This opposition in the Democratic presidential primary has virtually been personified in the form of U.S. Senator Bernie Sanders, a democratic socialist from Vermont who once honeymooned in the Soviet Union and had a softball team called the “People’s Republic of Burlington.” It is safe to say Sanders has not endeared himself to the capitalist crowd backing Clinton.Sanders does not rival Clinton’s endorsements or fundraising in this campaign, but he has become a thorn in her side with surprising success in generating support in early primary states. Recent polls indicate that Sanders and Clinton have a virtual tie in both Iowa and New Hampshire. Clinton has a huge lead in the next primaries (South Carolina and Nevada), but it is worth watching if news from the early primaries produces a feedback loop which trims her advantage.A major reason for Sanders’s unlikely ascendance is the attractiveness of his anti-Wall Street populism to progressive voters in the Democratic Party. The concise diction (“Break up the banks”) of his proposals is catchy and easily understandable at a superficial level, in contrast to wonkiness of Clinton’s proposals. Financial markets, however, are complex and the question of which candidate’s regulatory policies have more social benefit requires a nuanced analysis.Glass-Steagall: Should It Be Resurrected?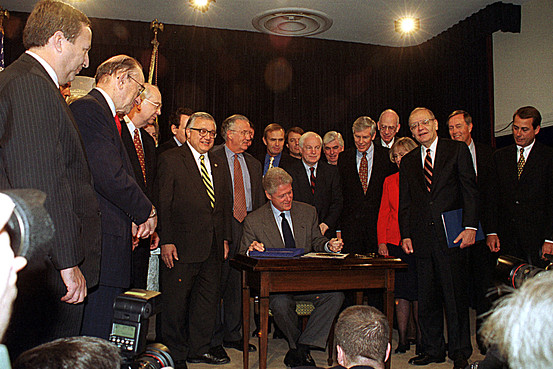 The Glass-Steagall Act was originally enacted in 1933 and it prohibited commercial banks from participating in the investment banking business. This was the case until the act was essentially repealed in 1999 under President Bill Clinton.Sanders has argued that the repeal of Glass-Steagall allowed investment banks to speculate with depositors’ money held in commercial banks, and, consequently, paved way for banks to merge with one another at a rapid pace to create institutions that were too big to fail. “Let’s not forget: President Franklin Roosevelt signed this bill into law precisely to prevent Wall Street speculators from causing another Great Depression,” Sanders said in a speech, according to boston.com. “And it worked for more than five decades, until Wall Street watered it down under President Reagan and killed it under President Clinton.”Clinton, like her husband, refutes the idea that Glass-Steagall triggered the financial crisis, pointing to the fact that the law would not have applied to any of the institutions at the heart of the crisis. New York Times columnist Andrew Ross Sorkin adds credence to Clinton’s argument by noting the irrelevance of Glass-Steagall to these institutions. For instance, Bear Stearns, Lehman Brothers, and Merrill Lynch were investment banks with no commercial banking business. For commercial banks like Bank of America and Wachovia, the problems stemmed from acquisitions of lenders Countrywide Financial and Golden West respectively. Other entities are not banks at all, and would not be regulated under Glass-Steagall: American International Group is an insurance company, while Fannie Mae and Freddie Mac are government-sponsored enterprises. When asked whether the financial crisis or JPMorgan Chase’s crisis-era $2 billion trading loss would have prevented by Glass-Steagall, U.S. Senator Elizabeth Warren (a leading proponent of restoring the act) conceded to Sorkin, “The answer is probably ‘No’ to both.”In fact, Bill Clinton argued that the rollback of Glass-Steagall made it easier for institutions to recover from the 2008 financial crisis, citing the acquisition of Merrill Lynch by Bank of America. In this context, it is difficult to prove that the rollback of Glass-Steagall has had adverse economic effects and there is some evidence was beneficial. There is a role for regulation of merged investment and commercial banks, but this should not inhibit the positive attributes of larger firms. While Glass-Steagall is an effective boogeyman for Sanders, it appears to be little more than that.Is Bigness Really Bad?
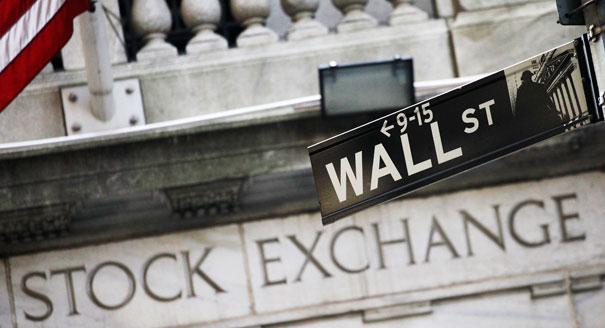 Sanders’ campaign taps into an American political legacy of distrust in capitalistic institutions which consists of Andrew Jackson’s demonization of the Second Bank of the United States as the “monster bank,” William Jennings Bryan’s “Cross of Gold” speech, and Theodore Roosevelt’s trust-busting campaign. The prospect of undermining the power of elite institutions especially resonates with the public in the aftermath of the 2007-08 financial crisis.POLITICO senior staff writer Michael Grunwald complicates the uplifting populist narrative underlying Sanders’ financial reform proposals by arguing that the size of the largest U.S. financial institutions is not merely a necessary evil in a capitalist economy, but a positive good: “If JP Morgan hadn’t been big and strong enough to absorb the hemorrhaging balance sheets of Bear Stearns and Washington Mutual, we might well have endured a depression. Ditto if Wells Fargo hadn’t been big and strong enough to let Wachovia collapse in its arms. The world is also lucky Bank of America was big and (arguably) dumb enough to salvage Countrywide and Merrill Lynch from the jaws of death.”Sanders’ fear of institutions becoming “too-big-to-fail” is rational to an extent given the interdependence between banks, but he is wrong to believe simply reducing the size of banks eradicates risk. His solution in the “Too Big To Fail, Too Big To Exist Act” even exacerbates risk by creating enormous uncertainty in financial markets: “the Financial Stability Oversight Council shall compile and submit to the Secretary of the Treasury a list of entities that it deems Too Big To Fail, which shall include, but is not limited to, any United States bank holding companies that have been identified as systemically important banks by the Financial Stability Board…the Secretary of the Treasury shall break up entities included on the Too Big To Fail List, so that their failure would no longer cause a catastrophic effect on the United States or global economy without a taxpayer bailout.”The act lacks any definition or guidelines on what constitutes an institution that is “Too Big To Fail” or what procedure is to be used to break it up. Moreover, the risk-averse nature of investors suggests that the natural result of this act’s vagueness will be lower lending to all individuals including those who are low-income and, consequently, lower economic growth. In essence, Sanders’ solution is worse than the problem.What is Clintonian Capitalism?
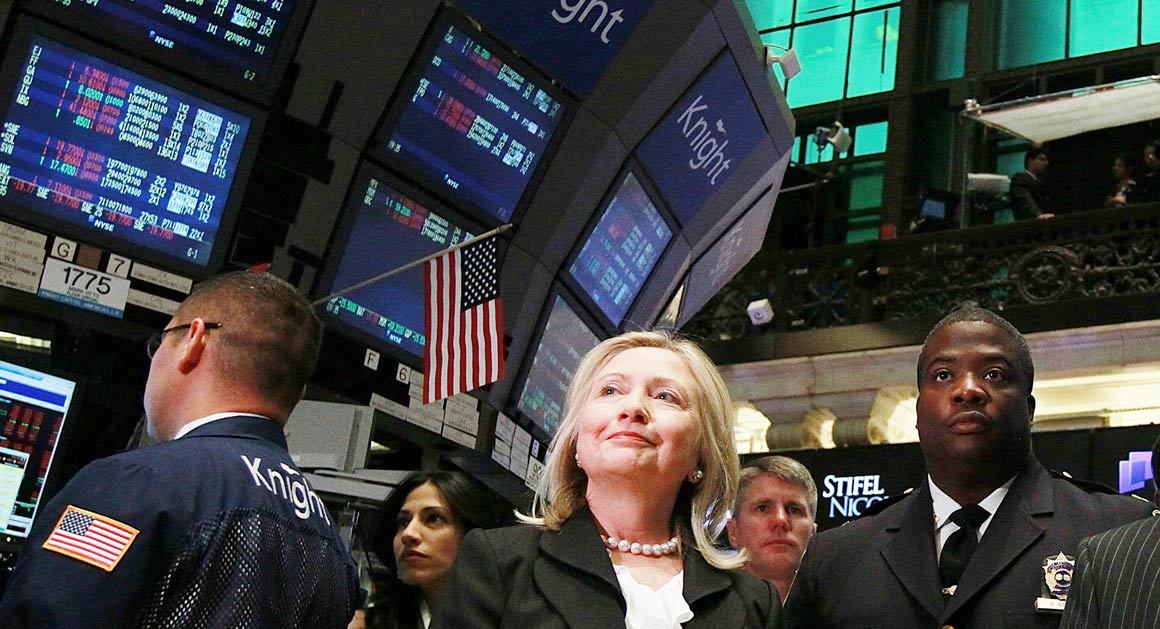
Aware of the need to counter Sanders’ populist message, Clinton wrote an op-ed which awkwardly attempts to reconcile leftist sentiment with an array of piecemeal reforms which enhance, rather than undermine, free-market capitalism. In one vein, she copies Sanders’ message by arguing, “I would also ensure that the federal government has—and is prepared to use—the authority and tools necessary to reorganize, downsize and ultimately break up any financial institution that is too large and risky to be managed effectively.” Like Sanders, she does not clarify what kind of tools she would use to orchestrate such a breakup.On the other hand, there is a less ambitious, but more useful theme underlying Clinton’s reforms: to level the playing field and equalize information for financial markets. Her proposal to increase leverage and liquidity requirements for broker-dealers and impose strict margin requirements for short-term borrowing might be onerous, but, if comprehensibly constructed, it would equalize the oversight of the traditionally less-regulated shadow banking system and its more heavily-regulated commercial banking counterpart. This is laudable, as the financial crisis was partly a product of the disproportionately low regulation of hedge funds, investment banks, government-sponsored enterprises, and other non-banking financial institutions which make up the shadow banking system.Moreover, Clinton’s proposal to independently fund the Securities and Exchange Commission and Commodity Futures Trading Commission would provide more stability and consistency in the enforcement of financial regulations. Her suggestion of a tax on high-frequency trading not only fulfills this goal, but it reduces the ability of some investors to exploit others who lack their quality of information to make an optimal decision. The virtue of these reforms come from the positive externality of lower uncertainty for investors which leads to a bigger societal risk appetite sufficient for economic growth. Clinton’s proposal has flaws, namely its absence of adequate details regarding the size and scope of future regulation, but its promise lies in an understanding of the nuances of financial markets that Sanders lacks.The VerdictSanders suggests that the nature of capitalism is inherently flawed and requires a drastic upheaval of large financial institutions. Clinton’s reforms instead are largely designed to tweak the framework of financial markets to more optimally utilize the capabilities of capitalism. I have concluded that Clinton’s plan is more conducive to economic growth, a stronger risk appetite, and even the goal of reducing wealth inequality championed by Sanders. Yet, I credit Sanders for pushing financial reform to the forefront of this presidential election campaign and pressuring Clinton to respond to his ideas. Ironically, the democratic socialist senator has demonstrated the virtues of a competitive marketplace of ideas with his presence in the Democratic primary.Author's Note: As always, the content of this post solely reflects the views of the author, not the Penn State Economics Association.
We’ve all experienced the inevitable logjam that results from entering the city, whether it’s New York or Los Angeles. We’ve pulled off the freeway, slowed to a crawl in the exit lane, and sat back for a long wait, as the traffic bottlenecks. And the closer we are to the stunning skyscrapers and bustling boulevards, the denser the logjam. Rush hour never ends in the city. But why? Why do hundreds of thousands of people pour in to these areas every day? And what does it mean for today’s world?Although several factors push people to move to cities, an overarching theme among them is the desire for a modern way of life. Workers come in search of employment opportunities in burgeoning sectors like services and technology that are less abundant in small towns and rural areas. Cities also tend to be more politically and socially progressive, due to greater accountability and cultural diversity. New York, for example, is a leader in “open data,” an urban policy that grants citizens access to a trove of information about the day-to-day operations of public services and government programs within the city. People – certainly young adults, who embody those flocking to the city – are attracted to this dynamism.According to the United Nations, approximately 4 billion people, or 54 percent of the global population, now live in urban areas. This number is projected to rise to nearly two-thirds of the global population by 2050, with most of the growth occurring in developing countries. Of the 4 billion today, 1 in 8 live in so-called “mega-cities” of over 10 million inhabitants, such as Tokyo, Delhi, Shanghai, and Mexico City. The world is urbanizing faster than ever before.As demographic power shifts towards cities, economic power is moving in the same direction. Cities account for over 80 percent of world GDP and are central to economic development. Not only do they benefit from large pools of consumers and talent, but they concentrate government, financial capital, and transportation and utilities infrastructure. This concentration helps to lower transaction costs and create networks conducive to innovation. The enhanced productivity of cities can drive growth and raise a country’s standards of living, including life in rural areas. They are also associated with lower fertility, a crucial aspect of the transition from “developing” to “developed.”However, not all cities are equally effective, nor are all inhabitants within a city equally well-off. On the contrary, cities are often known for stark income inequality. For every high-rise, there may be ten who are homeless or barely sheltered on the fringe; for every limousine and luxury boutique, there may be twenty who are struggling to pay bills on minimum-wage jobs. Indeed, cities often have vast informal economies in which workers earn much less than the minimum wage and cannot expect any stable income. These workers, especially women, are highly vulnerable to poverty traps. The disparity between the very wealthy and the extremely poor in cities is nowhere as apparent as in the slums, or informal settlements of the indigent. Here, crowding, unsanitary conditions, crime, and lack of access to utilities, healthcare, and education prevail. As population density increases, it becomes harder and harder to scale and share these resources among more people.The challenges to sustainability explain why megacities, despite their rapid rise and distinct advantages for economic growth, are not considered the ideal destinations for those seeking to relocate. Every year, the Economist Intelligence Unit ranks cities around the world by “liveability,” or a combination of their stability (safety), healthcare, education, infrastructure, and environment. At the top of the list are “mid-sized cities in wealthier countries with a relatively low population density,” rather than seemingly obvious world-class candidate cities like London.Fortunately, deliberate urban planning can bring cities of all sizes closer to their economic and social potential. The World Bank, one of many institutions to take on research in urban planning, is developing strategies focused on building affordable housing and climate-friendly infrastructure. The ability of governments to address these priorities and implement solutions will shape the future of cities – and in our increasingly urban world, our future as well.This blog post was written by Eleanor Tsai.Sourceshttp://www.economist.com/blogs/graphicdetail/2015/08/daily-chart-5http://www.ted.com/topics/citieshttp://www.theatlantic.com/business/archive/2012/05/what-is-the-worlds-most-economically-powerful-city/256841/http://www.worldbank.org/en/topic/urbandevelopment/overviewhttp://www.mckinsey.com/insights/urbanization/urban_worldhttp://esa.un.org/unpd/wup/Highlights/WUP2014-Highlights.pdf