Top

THE OPTIMAL BUNDLE: VOLUME 57

aoc.jpeg

The Optimal Bundle is a student publication run by the Penn State Economics Association’s Print Education Committee.In this edition, our contributors take a look at the future of the cell phone market, debate the effect of government crowding out private businesses, analyze the green new deal, and tell a story of The Onion King.

This is an online version of the print edition.

Editor: Patrick ReillyAssociates: Alex Ferracio, Jared Anderson, Zachary Shick.

THE OPTIMAL BUNDLE: VOLUME 56

bull.jpeg

The Optimal Bundle is a student publication run by the Penn State Economics Association’s Print Education Committee.In this edition, our contributors look at the questionable future of the current bull market, different sports betting strategies, home sales in the United States, and a more positive outlook for the bull market.

This is an online version of the print edition.Link to Bundle

Editor: Patrick ReillyAssociates: Holden Sabato, Jared Anderson, Zachary Shick. and Abeer Alghamdi

THE OPTIMAL BUNDLE: VOLUME 55

The Optimal Bundle is a student publication run by the Penn State Economics Association’s Print Education Committee.In this edition, Holden looks at quarterly earning reports, Jared looks at recent employment and wage data, Abeer analyzes sanctions on Iran, and Zach gives his opinion on fiat currency.

This is an online version of the print edition.

Editor: Patrick ReillyAssociates: Holden Sabato, Jared Anderson, Abeer Alghamdi, and Zachary Shick.Launch the Optimal Bundle

The Optimal Bundle: Volume 54

The Optimal Bundle is a student publication run by the Penn State Economics Association’s Print Education Committee.In this edition, our contributors take a look at the victims of the Trump vs China trade war, the competitive landscape of ride sharing companies Uber and Lyft, the future effects of increasing government deficits and a look at President Trump arguing with the Federal Reserve.

This is an online version of the print edition.

Editor: Patrick ReillyAssociates: Holden Sabato, Jared Anderson, Zachary Shick.October 23rd, 2018

Launch the Optimal Bundle

THE OPTIMAL BUNDLE: VOLUME 53

skyscrapers-perth-dusk-australia-freeways-city-hdr-wallpaper.jpg

The Optimal Bundle is a student publication run by the Penn State Economics Association’s Print Education Committee.In this edition, our contributors take a look at the consumer-side implications of using social media, dissect the foundations that have allowed Australia to avoid recession for 27 years, and share perspectives on the future of the cable television market.

This is an online version of the print edition.

Launch The Optimal Bundle

THE OPTIMAL BUNDLE: VOLUME 51

giza-pyramids.jpg

The Optimal Bundle is a student publication run by the Penn State Economics Association’s Print Education Committee.In this edition, our contributors look at the potential costs and benefits of capital punishment for drug traffickers, outline the professional trajectory of the new Director of the National Economic Council, and explore why governments have incentives to move their capital cities.

This is an online version of the print edition.

This edition was originally published on March 27, 2018.

Launch The Optimal Bundle

Economic Analysis and Basketball

game_3_of_the_2006_nba_finals.jpg

In increasingly competitive basketball conferences, professional teams are looking to get an edge on analysis-based games.  March 31, 2018By Peter Scharf_______It is Thursday March 30th and the opening day of the regular season for the Philadelphia Phillies and I am as least interested as I have been in years. Not because the Phillies are coming off a season where they posted one of the worst records in the league, not because most of the talent is not developed, and not because I have moved on to a win-now team. It is primarily because 1: Schoolwork in my final semester has slowly rotted away at my soul, 2: I have spent the last month or so taking my statistics skills into basketball, and 3: The Philadelphia 76ers are scorching the Earth that is the Eastern Conference. Basically, the Sixers, once the laughing stock of the NBA, have dominated and secured a playoff spot.With the Sixers advancing on analysis-based basketball and being snowed in at my Philadelphia home during Spring Break, I was inspired to build an NBA model that led to this post. To start, I will look into the game theory of basketball that the Sixers and a few other teams utilize.Maximizing Expected Shot ValueImagine a basketball court as some sort of weird matrix. Each area on the court has two components that go into the expected shot value, the worth of the shot and the percentage a shot from a certain area goes in. As a basketball player, or a coach coming up with a game plan, it would be desirable to shoot shots that maximize the expected shot value of a given situation.Up until the 1980 season in the NBA, the only way to do this was to get close to the basket. Big men dominated and much of the basketball action was closer to the rim. In 1980 things changed, the 3-point line was implemented. This made shots beyond its arc worth 0.5 times more than a standard shot.At first its usage was mainly as a gimmick.Today, teams are taking more threes than ever. As of this piece’s writing, the Houston Rockets are set to be the first team to ever take more threes than twos. The takeover of the three-point line has primarily been influenced by analytic based GMs and coaches maximizing expected shot value.Going back to the example of the basketball court matrix, the percentage of shots that go in decays the further you get away from the basket. Slam dunks, the closest shots, go in at near 100% clips. Long two’s and three’s dip under 50%. Basically, the further you get away from the basket the lower the percentage of shots that go in. This makes sense both statistically and in a “common sense” way. The further you are from the basket the harder it is for the ball to go in. Now, enter the three-point line.Although the league average on a 3-point shot is only 36%, the shot is worth 3 points and thus 3*.36=1.08 which is the expected shot value. Now imagine you are moving in towards the basket. Once you get inside 22 feet, you are no longer shooting a shot worth 3 points, however, the field goal percentage goes up.Shots from 15ft-22ft from the basket are worth two and go in 44% of the time. This leads to an expected shot value of 2*.44=.88, lower than taking a three. Moving even closer to the basket, the shot percentage goes up again. From 10ft-15ft out (approximately inside the distance from halfway to the foul line to the foul line), the field goal percentage climbs to nearly 50%.The expected shot value is approximately 1. Going on, 6ft-10ft’s expected shot value is 0.55*2=1.10, and under the basket to 6ft results in a 0.66*2= 1.32. Technically under the basket is only 0.82*2= 1.64.CaptureSo, what happened here? Three-point shots are worth more than one expected point, and not until you get within the foul line are shots worth more than 1 expected point. Being that defenses make it more difficult to get to the basket, often times it is a best response to not dribble in towards the hoop, but rather step back and take a three.Across a season with 1000s of shots being taken, the law of averages sways in your favor. The dominant strategy ends up being a mixed strategy of taking shots underneath, in the in the red and blue zones, as well as beyond the three-point arc in the purple. The green and yellow are not best response shots because if you can not get the ball to the red or blue, you are better off passing it behind you and taking a three.So what does a game plan look like following this strategy? Basically, shooters are posted on the outside around the three-point line and a big man is posted up underneath the basket. The point guard brings the ball up and attempts to get the ball to the big man as shots under 10ft are worth 1.32+ and if that is unavailable, he passes to one of the shooters for an expected shot value of 1.08. Following this plan of maximizing expected shot value, the team should average over 100 points per possession. Here is what it looks like in action.This is a screenshot of the Sixer’s March 19 win over the Hornets.Capture
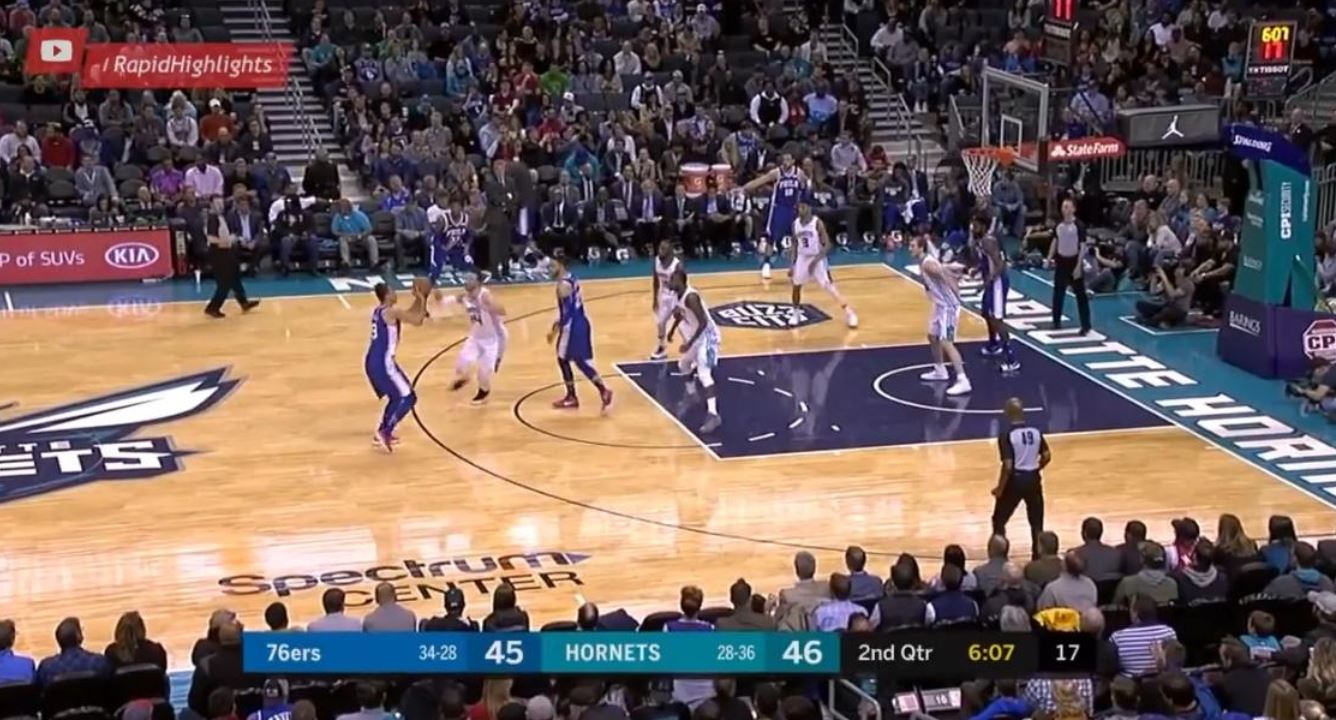
The Sixers, in blue, have all their offensive scorers located in areas that maximize expected shot value. Dario Saric, the player just beyond the arc taking the shot, Robert Covington, Saric’s left, and JJ Reddick, far corner, are all ready shooters with a high expected shot value because they are beyond the three. In this specific case, Saric, Reddick, and Covington are elite shooters and all shoot above 40% from three making their expected shot value 0.40*3=1.2. The other Sixer, Amir Johnson, is directly underneath the basket anticipating a pass or a rebound for another shot with a high expected value. The only Sixer not in a maximized space is Ben Simmons who brought the ball up to the foul line then turned around a passed it to Saric because the expected value of a foul line shot from Simmons is less than a Saric three.Philadelphia 76er’s former GM Sam Hinkie realized this as well. When selecting players in the draft or through transactions with other teams, he picked either big men or shooters. The plan was to run a maximized offense for the next 10 years. While Sam Hinkie is no longer GM of the Philadelphia 76ers, his selected shooters in Robert Covington and Dario Saric as well as big men in Joel Embiid and Richaun Holmes continue to run this analytic based offense.CaptureFormer Sixers GM Sam Hinkie talks with a young Joel Embiid shortly after his drafting. Using Econometrics to Forecast Basketball Games (and doing well)As evident by the fact that his name gets dropped in nearly every one of my blogs, I am a huge admirer of Nate Silver. Particularly how he takes economics and statistics and applies them to areas typically outside the field. In the area of sports, Nate Silver has shifted forecasting away from betting lines and ESPN “analysts” and more towards a quantitative and probabilistic approach. I figured if Nate Silver can do it, I can get close.Basketball seemed like the easiest sport to start forecasting. Looking at the top records in the league shows that the best teams generally win 70%-80% of their games. Compare this to a sport like baseball where teams are more even and the best team only wins 63% of their games. So essentially, basketball has more skill involved and less randomness, more signal to capture and less noise.At my aid are my new-found skills in R and enrollment in ECON483 Economic Forecasting (I highly recommend taking this course). I spent the first few days of my Spring Break gathering data and crunching numbers. Looking for patterns between wins, points and general basketball statistics. I began to diverge into two types of basketball forecasting, macroforecasting and microforecasting. Macroforecasting pertains to season long play. How many wins will the team have? Where will they place in their conference? Which team will score the most points this season? Macroforecasting does this very well.Capture
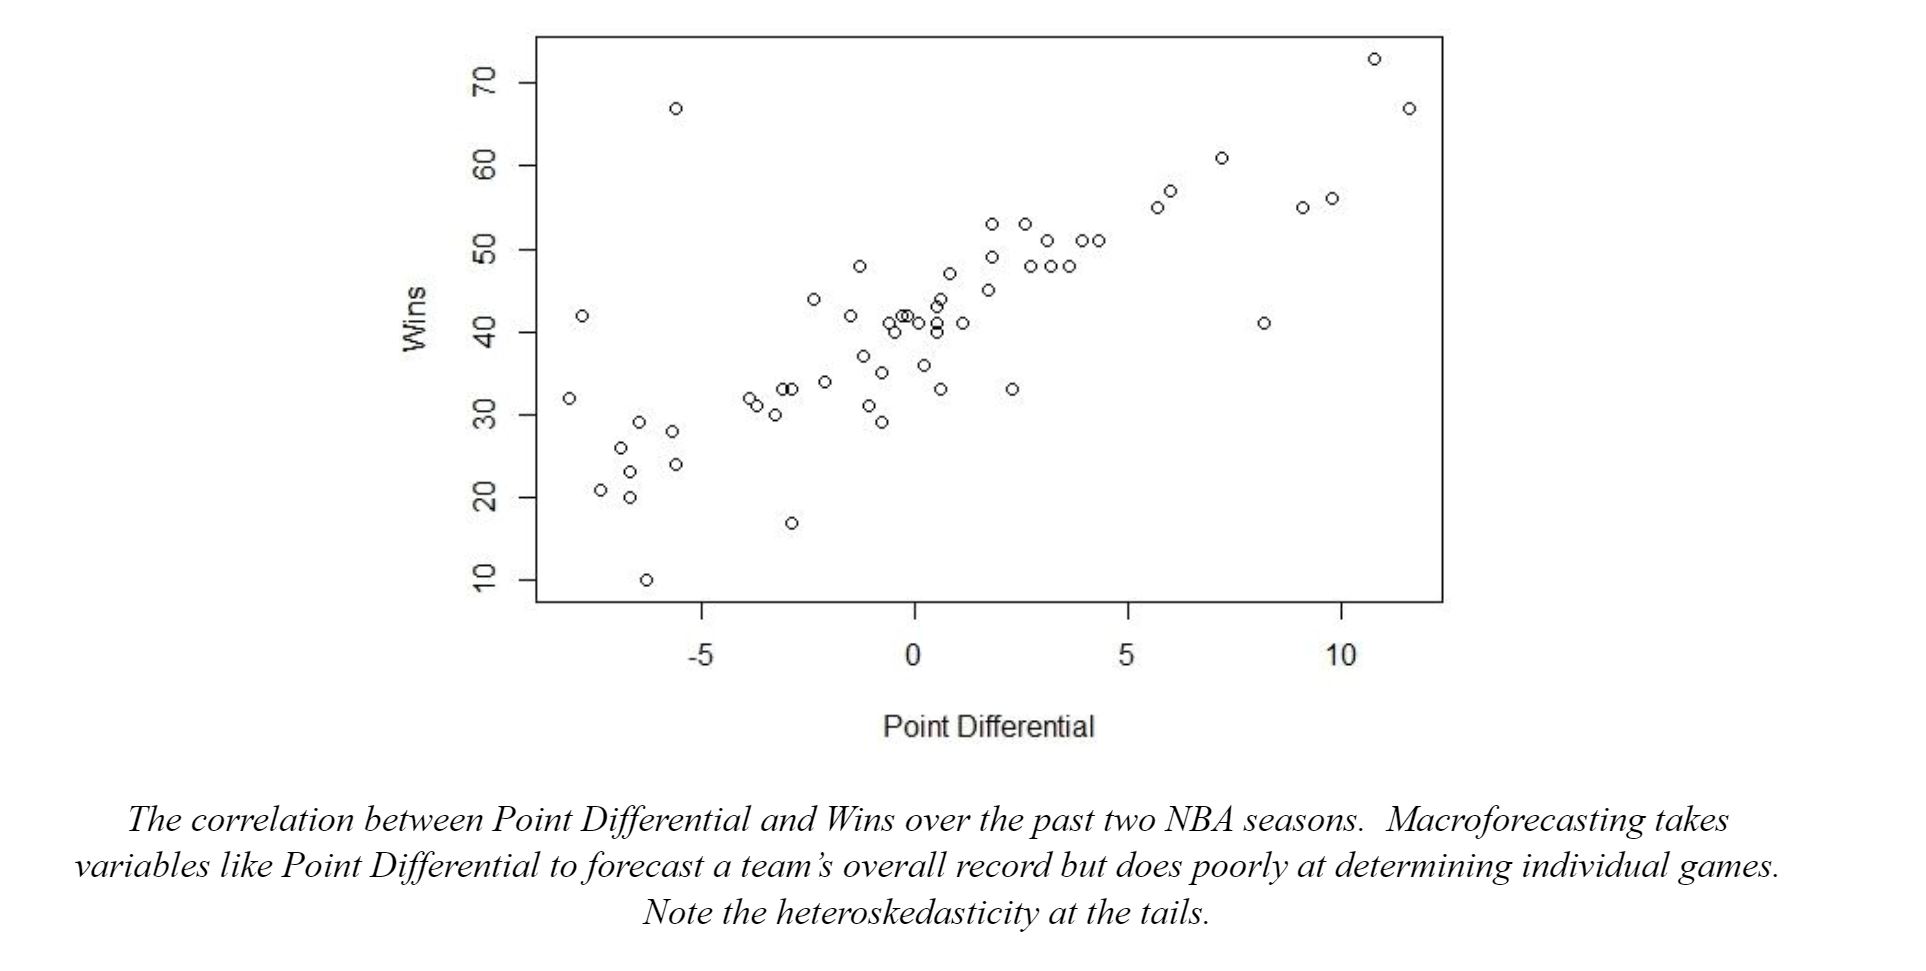
For individual games, the macroforecasting approach was not effective. I realized this when I was explaining my research to a friend and he responded “Who cares?, I just want to know who wins tonight!” .For game-by-game forecasting I needed to explore the microforecasting approach. This approach looks at the scoring and defense of the two teams in a game and determines in outcome, this approach ends up being much more difficult.To model an individual game, be careful about what stats you use. Player stats are often measured in three different ways: per game, per 100 possessions, and per 36 minutes. It is important to focus on per game stats. Per possession and per minute stats are better on player specific statistics but on a whole team they are a poor measure. Remember, every team only control the pace when they are on offense. Stats like offensive efficiency and defensive efficiency can be skewed by fast or slow offenses in an actual game format.My microforecasting model continues to be refined but it looks something like this:The result of the game is Yv - Yh where Y is the predicted points for each team. If this number is positive, the visitor wins. If it is negative it is a home victory. Y is composed of:CaptureWhere y is the predicted points, Ha is a dummy (binary) variable that is activate for the home team because across 2056 games a clear home field advantage was observed, B is an adjusted average of points scored per game, Dj is the defense added points of the opposition (good defenses this number is negative because they take away and bad defenses have this as a positive number. This number can also be influenced by how fast the opposing team’s offense runs.), and E is an error term. Numbers get rounded down to whole numbers because you cannot score half points in basketball. My actual running model is of course more complicated than this, but this equation accounts for most of it.As an example, let's use the Friday March 30th, 2018 7:30PM game with the Philadelphia 76ers facing off against the Atlanta Hawks. The Sixers forecasted score is:CaptureFor the Hawks it is:CaptureThus, the forecasted result is:Capture
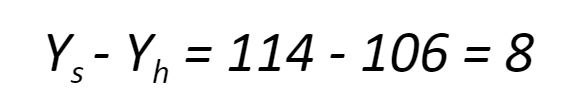
The model forecasts a Sixers, the visiting team, victory by plus 8. The actual game was much lower scoring than anticipated, particularly because the Sixers played their worst players in the 4th quarter to rest the starters for the playoffs, and the final score was 101-91. The Sixers won by 10 and the residual between the forecast and the actual score is -2. Although not perfect, sports are volatile and getting this close is impressive.To run this regression in programs like STATA and R, treat opposing defenses like seasonality. This will treat the opposing defenses like dummy variables and apply them when the team name is equal to a certain character value. To visualize the effect of opponent defense on score look at the plot below. It is the 76ers scores for each game plotted twice, to the left of the black line for unadjusted and to the right for adjusted. The red dashed lines are at 119 and 99 (within one standard deviation) and the green line is the Sixer’s B of 109. Although slightly, the right side of the black line is more correlated around the mean.Capture
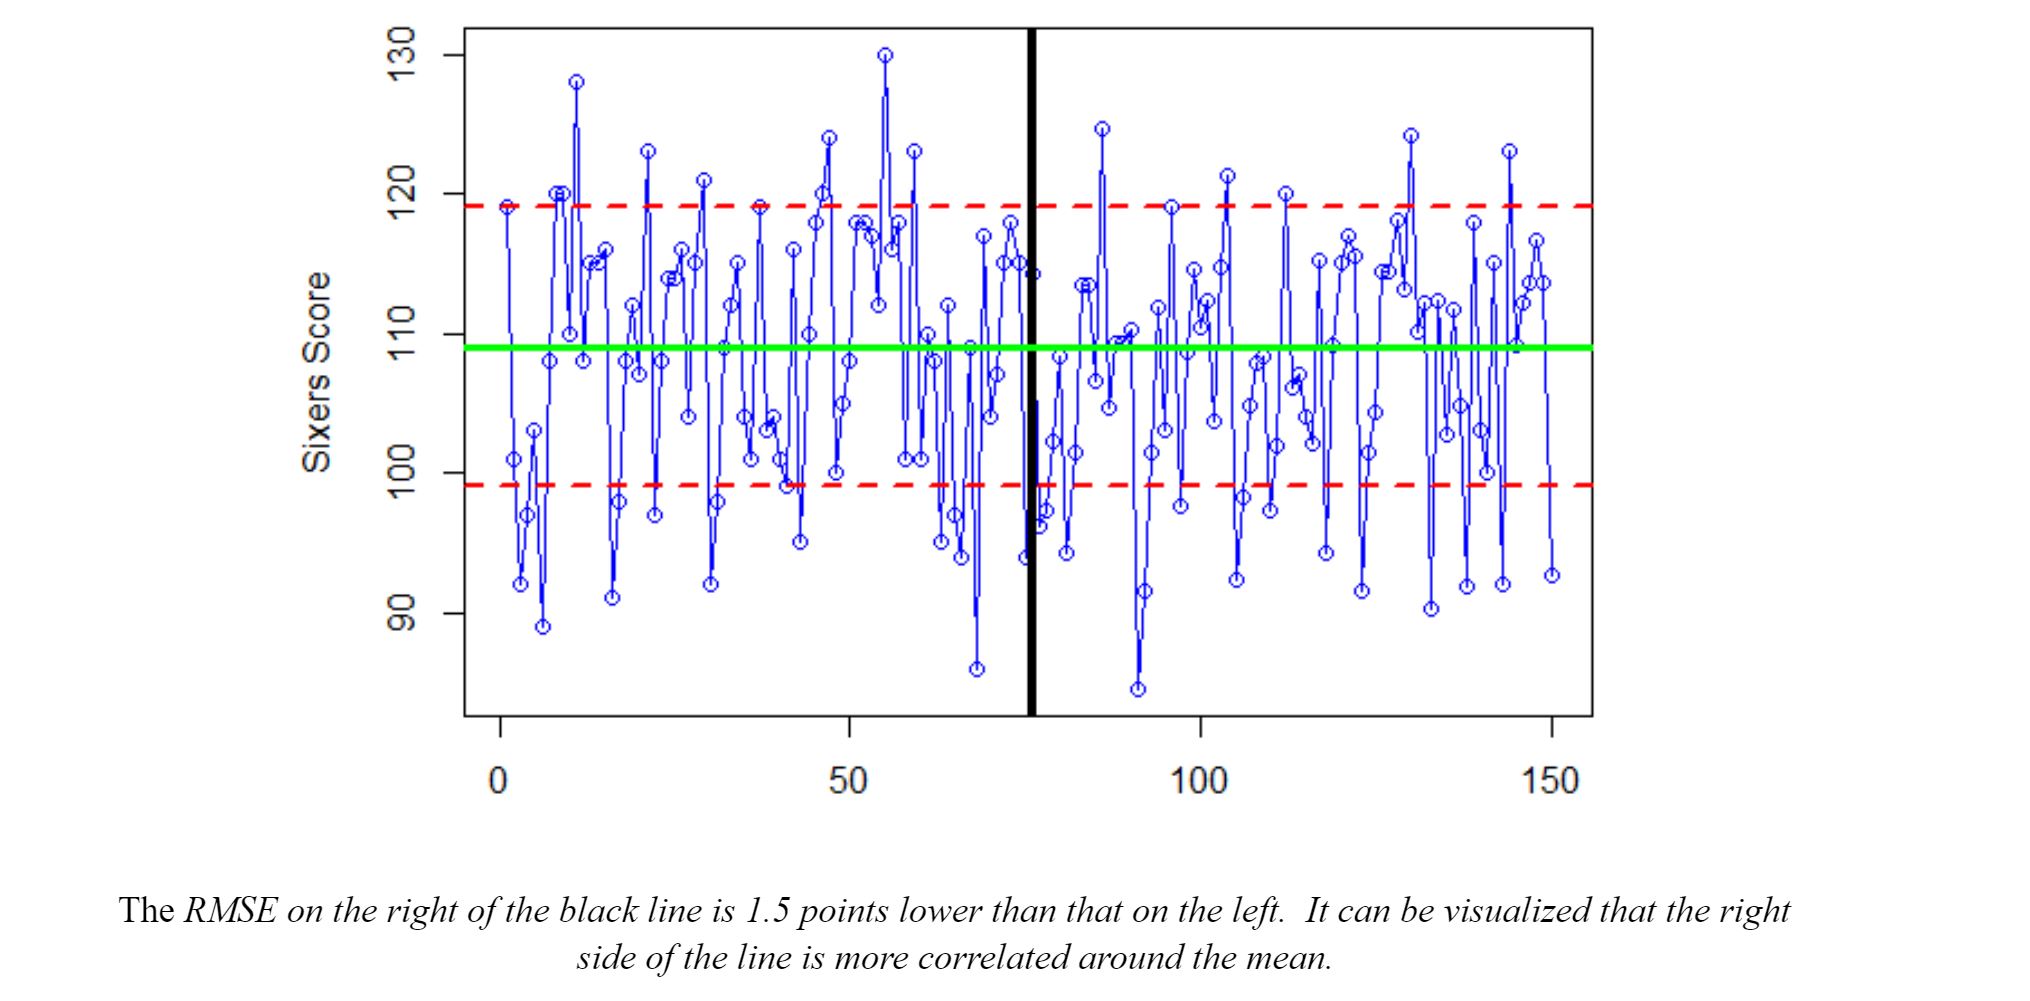
As a sports fan, using the stat and game theory skills I picked up in the classroom through the B.S. in Economics allows me to get involved with the game. I have become a more informed fan, despite only watching half of my home team’s games. I encourage anyone to apply statistics to an interest of theirs, it is surprisingly fun and gives new insights into that field._______ Author's Note: All statistical data comes from basketballreference.com All analysis and graphing was done using R within Rstudio or Microsoft Excel. For more information contact optimalbundle.psuea@psu.edu. Editor's Note: Minor changes have been made to the original version of this piece. Feature Image Credit: Public Domain

THE OPTIMAL BUNDLE: VOLUME 50

joseph_walter_-_shipping_off_bristol.jpg

The Optimal Bundle is a student publication run by the Penn State Economics Association’s Print Education Committee.In this edition, our contributors analyze the potential effects of the Trump Administration's decision to impose tariffs on aluminum and steel imports, take a look at the trajectory of wage growth, and outline geopolitical shifts in East Asia.

This is an online version of the print edition.

Launch The Optimal Bundle

Shifts in the Pennsylvania Healthcare Market

2560px-asylum_township.jpg

A lucrative but geographically challenging market is the battleground for some of the Commonwealth's largest health networks. March 7, 2018By Nicolas Guerrero_____

In the years following the implementation of the Affordable Care Act, its provisions and resulting cost increases led to a series of reconfigurations in healthcare markets across the country. Pennsylvania is a market where healthcare providers and insurers have found a particular need for steadfast consolidation.

Three entities dominate a geographically challenging, yet lucrative healthcare market. The University of Pittsburgh Medical Center (UPMC) is the largest non-governmental employer in Pennsylvania. Headquartered in downtown Pittsburgh, UPMC operates over thirty hospitals in the western and central regions of the state. In addition, UPMC Insurance Services covers over 3.4 million members.

Penn State Health operates the flagship Milton S. Hershey Medical Center, Children’s Hospital and Cancer institute in Hershey, the Penn State Health St. Joseph Hospital in Reading, and 120 medical offices across the Commonwealth. Generating between $1.3 and $1.5 billion in annual revenue, Penn State Health is a major health system and its flagship hospital is the largest in the Greater Harrisburg region.

The University of Pennsylvania Health System, Penn Medicine is the state’s second most lucrative network after UPMC generating around $5.3 billion in annual revenue and operates six hospitals and eight multispecialty facilities along the eastern flank of the state.

Capture

The urban markets of Philadelphia and Pittsburgh are separated by 300 miles of vast, sparsely populated rural countryside where medical facilities are likely operated by a dominant regional health system.

In March 2015, the Penn State Milton S. Hershey Medical Center completed plans to merge with PinnacleHealth System, the other dominant healthcare provider in the Harrisburg area. Together, both entities would operate as a single network providing health services for Dauphin County and surrounding markets. In December of that year, The Federal Trade Commission (FTC) filed a lawsuit halting any further action and requesting further information. The FTC, along with the Pennsylvania Office of the Attorney General argued that such merger would create a regional monopoly, increasing prices and potentially lowering quality for the South-Central Pennsylvania market. Yet markets are ambiguous and difficult to make out with naked perceptions.

This particular point was made by the United States District Court, which argued that the FTC had failed to define which specific markets would be harmed by the merger. For horizontal mergers, such as the one between Penn State Hershey and PinnacleHealth—where both merging entities are within the same or similar industry—federal anti-trust authorities apply the hypothetical monopolist test to clearly define such market. In this test, the relevant geographic market is the smallest area in which a single firm could raise prices without consumers resorting to firms outside the region to avoid such a price increase.

Capture

The Harvard Law Review notes that District Court found that the FTC had not adequately defined the relevant market as the four-county area around Harrisburg, and “that 43.5% of Penn State Hershey’s patients travel to the hospital from outside of the region, suggesting that the FTC’s proposed market failed to properly account for where the hospitals draw their business”. When the Third Circuit Court of Appeals reversed the District Court’s decision, Penn State spent $17 million on legal arguments in an unsuccessful attempt to push for the merger. The motivation behind the Penn State Hershey-PinnacleHealth merger focused on the benefits by scale economies in a market perceived as underserved by University officials and Pinnacle executives. The 64% market share that both entities would have represented in the region was to be transitory, as equally large health “megasystems” such UPMC and Penn Medicine were quickly expanding into the central Pennsylvania market.

Penn State Hershey CEO Craig Hillemeier argues that with Penn State Hershey operating at near full capacity, the merger would have given the medical campus the size and efficiencies required to compete with entering firms without sacrificing patient care. According to both entities, merging the firms would have led to decreased operating costs, increased flexibility in transferring patients to other hospital locations, lower construction costs, and lower costs for patients on a case-by-case basis. The Penn State University Board Trustees dropped all litigation efforts the following year. The projected legal costs coming out of University coffers outweighed the benefits of completing what seemed to be a lengthy merger process.

CapturePinnacleHealth already searching for capital, immediately shifted its focus to its next potential partner. In 2017 PinnacleHealth successfully merged with UPMC, further consolidating Pennsylvania’s largest health system. As predicted, the newly created UPMCPinnalce expanded quickly, operating 12 hospitals in ten counties across central Pennsylvania.

Expanding in this region is cost-effective for a behemoth like UPMC, where operating costs for existing hospitals and construction costs for new ones are relatively low. Some of these regional hospitals have between ten and sixty beds and serve markets that no other healthcare provider would likely find economic sense in entering.

Lancaster General Health was acquired by Penn Medicine in 2015. This westward encroachment by a Philadelphia-based firm alerted UPMC and Penn State Health, as the fragile central Pennsylvania market has relatively fixed demand. This contributed to Penn State’s increased “megasystems” competition argument during federal litigation. Should Penn Medicine seek to expand beyond Greater Philadelphia, it will add more pressure to competing health systems, and find several health networks already setting their eyes on the lucrative region. That is what UPMC discovered and successfully tackled when it expanded eastward of Pittsburgh. Penn Medicine has the financial resources and acclaimed reputation to be just as successful.

Capture

With health systems quickly growing across the Commonwealth, Penn State Health sought to find a partner that would be reputable and profitable in the face of aggressive competition. After the failed attempt to merge with PinnacleHealth, university resources had to be used carefully, objectives had to be clear, and litigation avoided if possible. Without being neither a merger nor acquisition, Penn State Health partnered with Highmark, the largest insurance provider in the state.

Under this agreement, Highmark ends its partnership with UPMC, and gives an infusion of capital to Penn State Health, allowing it to build new hospitals and facilities to directly compete for UPMC’s consumers. $1 billion will be used to update and expand Penn State Health operations. In exchange, Highmark will send its members to the Penn State Health system hospitals and physicians. The insurer now has three seats on Penn State Health’s fifteen-person board. Thus, Highmark becomes a healthcare insurer and provider through this partnership, just like UPMC.

___________ Featured Image: The Susquehanna River flows through central Pennsylvania Image Credit: Pubic Domain

THE OPTIMAL BUNDLE: VOLUME 49

476894734.jpg

The Optimal Bundle is a student publication run by the Penn State Economics Association’s Print Education Committee.In this edition, our contributors take a closer look at the effect of a tight labor market on the 2018 graduating class, analyze the utility of major athletic events such as the Olympics, and review the President's infrastructure initiative.

This is an online version of the print edition.

Launch The Optimal Bundle


Understanding the VIX Index

cboe-e1519122945792.jpg

The Chicago-based volatility index attempts to give investors a tool to calculate impending fluctuations in the market.February 16, 2018By Patrick Reilly_______The CBOE Volatility Index, known by its ticker symbol, VIX is a tool that investors use to estimate fear in the marketplace. The VIX was created in 1993 through the Chicago Board of Trade and was the first way to measure volatility in the stock market.One way to think about it is that the VIX is like buying insurance. If you live in Florida and you hear that a hurricane is coming you’ll be willing to pay much more for insurance because there’s a higher chance that you’ll need insurance. You will pay more than you would normally.It’s very similar for investors if they’re afraid of a stock market crash, they’ll be willing to pay more for the VIX. The price level of the VIX is calculated using the price of put options on index funds. That sounds complicated but put options are just bets that the price of the stock market will go down. So if people think that a stock market crash is coming the price of the VIX will go up very quickly. Investing in the VIX implies that you’re anxious about the economy in the near future. However, over the last couple years, before this month, there wasn’t much to be anxious about. VIX 1 
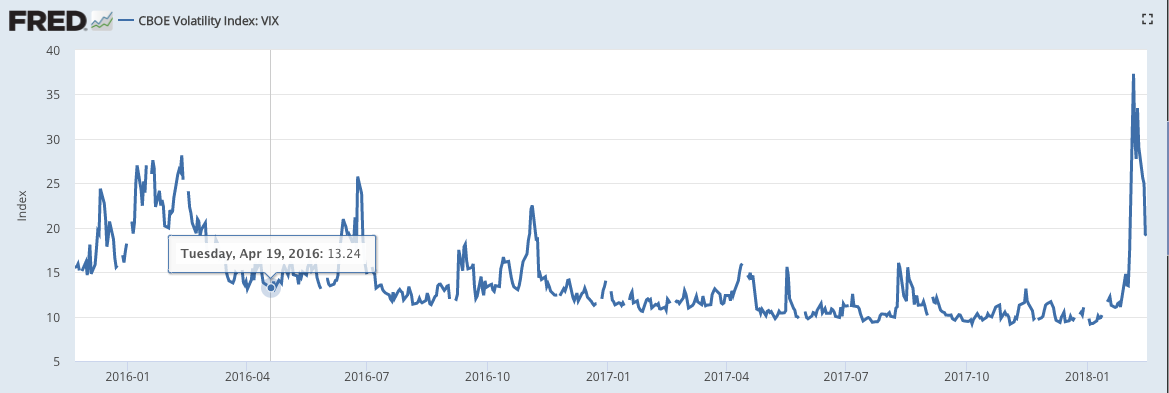
The value of the VIX was steady at historically low levels of around 10 for several years. This led to the creation of the XIV, the inverse of the volatility index. Every time the value of the volatility index VIX increased, the price of XIV would decrease and vice versa. Investing in the XIV means that you were willing to bet that there wouldn’t be any hurricanes in the near future and that low volatility would continue. So over the last several years this was a good bet with steady income as the VIX fell consistently the price of the XIV increased consistently, until this month. vix 2 
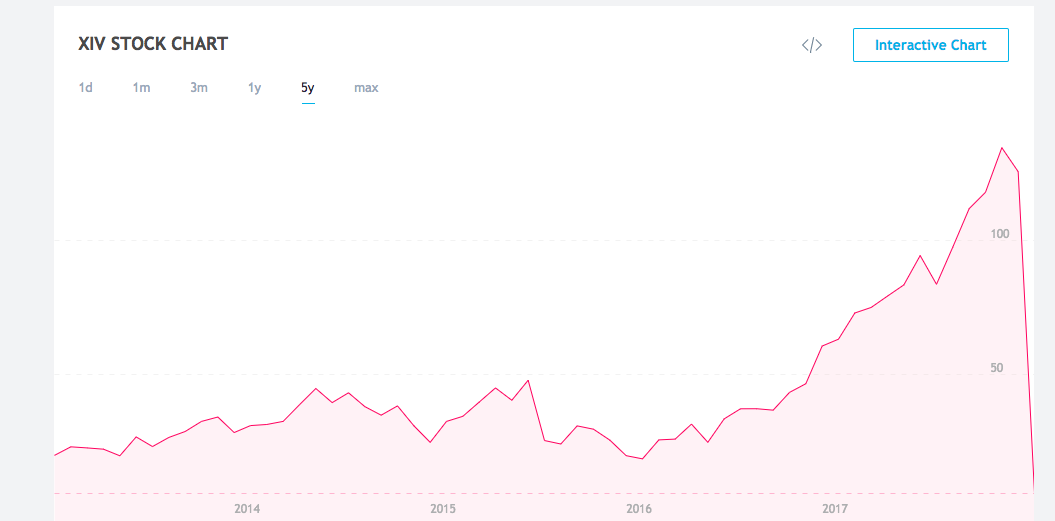
Over the last year the price of the XIV was rising fast to a level over 100 until it crashed. In about two weeks the XIV lost 100% of it’s value and is no longer available for purchase.At the same time the price of the VIX rose to levels not seen since the 2008 financial crisis.Hopefully that all made sense but there’s one more wrench that was thrown into the equation. A whistleblower told regulators that there was a scheme to manipulate the VIX. Let’s say that you are a weatherman in Florida and own flood insurance and want to sell that flood insurance to someone else. You could go on TV and lie and say there are 10 category five hurricanes on their way and the value of your flood insurance would increase and you could sell at a profit.Similarly, if you could raise the price of the put options that the volatility index is priced off of then you would know that the price of the VIX will rise and the price of the XIV will fall. You could do this by raising fears of an impending stock market collapse or just buy the put options yourself and increase the demand and price. If you know the future prices of the VIX and XIV you could make a lot of money quite easily. The Chicago-based exchange denied the accusations but it does make sense to me at least in theory if you have enough money. The accusations are interesting and if proven would be a pretty brilliant money making scheme although illegal. On the other hand the price of the VIX could have just risen because there was a stock market correction happening. It’ll be interesting to see in the near future if there are any truth behind the allegations.___________Photo Credit: Modern Farmer Featured Image: The trading floor of the Chicago Board of Trade

THE OPTIMAL BUNDLE: VOLUME 48

janet-yellen-federal-reserve-e1517980962551.jpg

The Optimal Bundle is a student publication run by the Penn State Economics Association’s Print Education Committee.In this edition, our contributors take a closer look at fluctuation in equity markets, analyze the ripple effects of DACA, and review Janet Yellen's skillful navigation of the American economy as she steps down as Chair of the Federal Reserve.

This is an online version of the print edition.

Launch The Optimal Bundle

Extraordinary Incentives

new-toronto-e1518616646519.jpg

As online retail giant Amazon narrows its quest to find a location for its second headquarters, local governments across North America are testing the limits of economic incentives.February 2, 2018By Avery Ryan_______Within the past few months, The race to host Amazon’s headquarters has intensified and is now boiled down to a list of twenty cities still in the running. Earlier in January, Amazon released a list of finalists, which identified the 20 out of the 238 bids from across North America that were still being considered for hosting the new headquarters. These finalists are Philadelphia, Boston, Toronto, Atlanta, New York, Washington, Miami, among others. The reason behind the fierce competition lies in the opportunities that hosting operations for a company such as Amazon would bring for a city and surrounding metro area.Being the location of Amazon's headquarters  bring a long list of benefits. As many as 50,000 new jobs would be created. The winning city would receive great publicity as well. Overall, acquiring Amazon’s headquarters is most American mayor’s dream come true.However, the race has turned quite serious in the past few weeks. Cities are going to extremes in order to get Amazon’s pick, and it may be doing more harm than good. Cities have offered billions of dollars in tax subsidies in order to attract the firm. Amazon CEO, Jeff Bezos, is operating this deal with a degree of secrecy, making it harder for city leaders to figure out how to best win over the $675 billion company. For example, New Jersey has offered $7 billion in tax-breaks for Amazon if it chooses Newark for the new headquarters. While Amazon's entry will bring more revenue and jobs, the city will have to take other risks into consideration. They must consider widening roads, hiring more teachers, and building more housing. The cost of all of these upgrades, according to the Washington Post, is going to fall on residents and small business owners of the city. Residents who will have to pay more in a state with already high tax levels may not be as willing to jump on board. Small and mid-size businesses will have to play a role in the repayment of these tax subsidies. Smaller firms, with Amazon being an unrivaled behemoth, will not be pleased that their tax dollars will be supporting their competition.An interesting deal may arise in the greater Washington, D.C. area, where 3 of the finalist cities are located. Muriel Bowser, the mayor of Washington, D.C. made a statement regarding how the headquarters of a company of such size would equally benefit her city, Northern Virginia, or Montgomery County, Maryland. Economists, along with public policy experts, agree that these three finalist cities should collaborate in order to convince Amazon to come to any of the three cities.PrecedentsThis race for a facility to be placed in a city in order to gain revenue and improve standard of living is nothing new. Sports franchises cause the same kind of competition between cities due to the enormous amount of revenue generated in this business. Cities will fight to acquire sports franchises, and sometimes are forced to spend large sums of money just to keep them in the city. Similarly to the Amazon situation, economists question whether or not this decision by city leaders is more helpful or harmful.Brad. R. Humphreys, an economics professor at West Virginia University , researches the economics of professional sports. In a piece for the Regional Science and Urban Economics Journal, Humphreys wrote about a change in viewpoint about the benefits of tax subsidies for the purpose of sports franchises. Between 1950 and 2010, an estimated $59 billion in 2006 dollars were spent on the building of sports facilities in the United States. Humphreys notes that the business done inside these stadiums is entirely private enterprise and the revenues generated from private sporting events are split between the employees, players, and owners. There are not many other private profit-generating firms that receive such large amounts of tax subsidies. Humphreys suggests that while it has been said that these facilities increase jobs, create higher incomes, and increase tax revenues in the past, that may not be the case anymore.Proponents of sports facilities are now justifying the subsidies with urban redevelopment. The bulk of this journal analyzes a spatial model that suggests that cities are giving out subsidies to these sports franchises despite the lack of evidence that the construction of these sports facilities create fiscal benefits for a local economy.The similarities between sports franchises and Amazon’s headquarters bring up an interesting question for cities that are still in the running for Jeff Bezos’ competition. Providing such large subsidies may be guiding cities in the wrong direction. However, the race is still on and the cities are still pushing. Whichever city finishes in first place will be the new home of Amazon’s second headquarters, and will experience the externalities--both positive and negative--of experimenting with incentives of such magnitude.________ Featured Image: Central Toronto. Toronto is the only city outside of the U.S. to be considered by Amazon to host its new headquarters. Photo Credit: Michael Muraz Referenceshttps://www.washingtonpost.com/business/economy/for-finalists-in-the-amazon-headquarters-sweepstakes-the-fun-has-turned-serious/2018/01/26/b517a196-0179-11e8-bb03-722769454f82_story.html?utm_term=.f7e48414fe34Humphreys, Brad R., and Li Zhou. “Sports Facilities, Agglomeration, and Public Subsidies.” Regional Science and Urban Economics, vol. 54, 2015, pp. 60–73., doi:10.1016/j.regsciurbeco.2015.07.004.

Unpacking Tax Reform

d18eed6565e8062fb133b5fc89410177.jpg

New tax legislation poses challenges for some Americans, but enthuses and incentivizes productivity for others. January 19, 2018

Patrick Reilly, Nazmus Mallick, Avery Ryan, and Peter Scharf

________

The newly passed tax bill, officially legislated as H.R. 1 or Act to Provide for Reconciliation Pursuant to Titles II and V of the Concurrent Resolution on the Budget for Fiscal Year 2018, was signed into law by President Donald Trump on December 22, 2017. It passed through the House of Representatives and the Senate along party lines. According to the bipartisan Committee for a Responsible Federal Budget, H.R. 1 includes the eighth largest tax cut since 1918 and the fourth largest since 1949 when adjusted for inflation. It is American firms that are projected to reap most benefits from the new tax bill. For example, Warren Buffett’s Berkshire Hathaway is expected to have a twelve percent increase in profits resulting in a $37 billion gain. In the short-run, both corporations and employees will see benefits resulting from the tax reform, but more time is required in order to see other, more complex effects such as a likely increase in the national deficit. A report released by KPMG immediately following the enactment estimates that the law provides an overall tax reduction of $1.456 trillion over the next decade when not accounting for the fluctuations of the business cycle. One of the provisions within the new law includes the permanent repeal of health care subsidies and the mandate that requires all individuals over the age of twenty-six to join a health insurance system, both which were part of the Affordable Care Act, the Obama Administration’s flagship piece of legislation. Repealing the individual mandate is estimated to reduce the federal deficit by $338 billion within a period of eleven years, but result in 13 million Americans not obtaining health insurance while premiums are projected to increase by ten percent.

Capture

According to estimates by Harvard economist Robert Barro, cutting the average marginal tax rate for individuals by 1% will increase GDP by 0.5% over the next two years. In other words, a cut in tax rate will increase the amount of disposable income available to the citizens thus increasing their purchasing power. This will tend to have an expansionary effect on the economy as consumer spending and investment is likely to increase.

Such change in fiscal policy affects several sectors of the American economy. One effect that has been analyzed so far is how the corporate tax cuts within H.R. 1 is affecting activity in capital markets. Currently, the stock market is thriving and many, including the president himself, believe that such growth is catalyzed by the recent tax overhaul.

“Just a few weeks after major tax reform legislation was approved by Congress and signed by President Trump, we are seeing the broad benefits of economic growth...The Dow has climbed to a new all-time record, over 26,000 in the past few days. That reflects $7.2 trillion in new wealth added to the economy over the first year of the Trump presidency, broadly shared by everyone with stock ownership, either directly, or through pension plans and retirement savings.”Lewis K. UhlerFounder, National Tax Limitation Committee

In a January 11 interview with the Wall Street Journal, President Trump told a reporter that, “The tax bill has turned out to be far greater than we ever anticipated… It’s selling itself.” The President's confidence is not left unsupported. Trend Macrolytics LLC Chief Investment Officer Donald Luskin stated that since the passing of the tax bill, Wall Street Journal analysts have increased their projections for earnings in the S&P 500 by an unprecedented 4.6%. Due to the corporate tax cut from 35% to 21%, a confidence boost in the stock market has led to its noticeable growth. Warren Buffet voiced his opinion regarding the tax cut to CNBC, “You had this major change in the silent stockholder in American business who has been content with 35 percent ... and now instead of getting 35 percent interest in the earnings they get a 21 percent and that makes the remaining stock more valuable." While there are pundits and analysts issuing warnings about an impending stock market crash, it is important to remember that markets are dependent on consumer confidence. Bullish activity reveals that at a minimum, investors are confident about the future of the economy under the Trump presidency. In the days following the passage, corporations like Wells Fargo, Bank of America, and J.P. Morgan announced cash bonuses for thousands of their employees, partly due to reinvigorated incentives. The drive for investing means that people are betting on economic success, increased real wages, and higher business profits. All of the effects that the tax cut has had on the stock market seem to be positive due to growth. However, it is important to keep in mind that while this growth enthuses C-suite executives, polls reveal that it does not do the same for a significant portion of the public. The middle class and lower income earners will see mixed results. The Institute on Taxation and Economic Policy analyzed the H.R. 1 to see how tax cuts and hikes were distributed across income percentiles and across time as provisions within the bill change the tax rates by year. These figures also factored in the elimination of the penalty on the healthcare mandate, which is a small tax cut in itself for the lower income earners. The middle 20% of income earners will see a reduction in taxes of about 1.5% in the first years of the bill and that will slowly decrease over time with the 2027 estimate being a net zero change in taxes. The lower middle class, the bottom 20%-40% of income earners, will benefit similarly in 2018 with an expected reduction of 1.3% in taxes that will shrink to a net .5% increase in taxes by 2027. The 60%-80% of income earners will do slightly better with a reduction of 1.6% on their federal taxes to start and a net neutral tax effect by the bills end. By far the winners of this tax bill were the top 10% of income earners who will see reductions of close to 5% on their tax bills and will see slightly smaller decreases through time.The Tax Foundation’s analysis centered on the benefits to hypothetical households involved during the bills early stages in the late 2010s and found that every income level will benefit from the new tax bill. The lower marginal tax rates coupled with a larger standard deduction were the primary reasons for lower taxes among the middle and lower class groups. A larger and more accessible child tax credit is a potential benefit for families in the middle of the income distribution. These calculations were made without factoring in the effect of the individual healthcare mandate and ignore the changing nature of the bill over time.One unlikely entity that will be negatively affected by the new tax bill is Penn State Football. Previously, alumni and other boosters could write off the cost of season tickets and luxury boxes as tax-deductible charitable contributions. According to the newly revised tax code, buying the best seats for a Penn State football game is not considered a charitable donation and is not included in the new law. At the University of Georgia the right to buy luxury box seats can cost $60,000 a year, which was tax deductible. It is now likely that demand for luxury boxes could fall.___________Nicolas Guerrero contributed to this essay. Featured Image:Ben Aronson (1958-present) AmericanSunset, Chicago River (2014) Oil on Panel  BibliographyThe First Trump-GOP Tax Bill: National and 50-State Analysis. Institute on Taxation and Economic Policy. December 2017. https://itep.org/wp-content/uploads/Trump-GOP-Final-Bill-Report.pdfLorin, Janet; Novin-Williams Eben. College Football Teams Mount Blitz to Lock In Donors' Tax Breaks. BloombergPursuits. December 22, 2017. https://www.bloomberg.com/news/articles/2017-12-22/college-football-teams-mount-blitz-to-lock-in-donors-tax-breaksShell, Adams. List of companies that paid bonuses or boosted pay since tax bill passed. USA Today. January 11, 2018.  https://www.usatoday.com/story/money/2018/01/11/list-companies-paid-bonuses-boosted-pay-since-tax-bill-passed/1023848001/Buhayar, Noah. Berkshire to Reap Estimated $37 Billion Bump From U.S. Tax Cut. Bloomberg LP. January 8, 2018. https://www.bloomberg.com/news/articles/2018-01-08/berkshire-to-reap-estimated-37-billion-bump-from-u-s-tax-cutEl-Sibaie, Amir. Who Gets a Tax Cut Under the Tax Cuts and Jobs Act? Tax Foundation. December 19, 2017. https://taxfoundation.org/final-tax-cuts-and-jobs-act-taxpayer-impacts/Rep. Brady, Kevin. (R-TX) [Sponsor]. United States House of Representatives - 115th Congress (2017-2018). United States House of Representatives Ways and Means Committee. H.R.1 - An Act to provide for reconciliation pursuant to titles II and V of the concurrent resolution on the budget for fiscal year 2018. Public Law No: 115-97. December 22, 2017. https://www.congress.gov/bill/115th-congress/house-bill/1New Tax Law (HR1) Initial Observations. Klynveld Peat Marwick Goerdeler [KPMG] December 22, 2017. https://home.kpmg.com/content/dam/kpmg/us/pdf/2017/12/tnf-new-tax-law-dec22-2017.pdfTranscript of donald trump interview with the wall street journal. (2018, Jan 14). Wall Street Journal (Online) Retrieved from http://ezaccess.libraries.psu.edu/login?url=https://search-proquest-com.ezaccess.libraries.psu.edu/docview/1987216534?accountid=13158Luskin, D. L. (2018, Jan 12). Tax reform has released the bulls. Wall Street Journal Retrieved from http://ezaccess.libraries.psu.edu/login?url=https://search-proquest-com.ezaccess.libraries.psu.edu/docview/1986575861?accountid=13158Kim, Tae. Warren Buffett says 'huge' corporate tax cut is 'not baked in' stock market. CNBC. January 10, 2018. https://www.cnbc.com/2018/01/10/warren-buffett-says-huge-corporate-tax-cut-is-not-baked-in-stock-market.htmlHarper, Jennifer. Desperate Trump critics rage against the stock market boom. The Washington Times. January 18, 2018. https://www.washingtontimes.com/news/2018/jan/18/though-the-economy-appears-to-be-humming-and-happy/ 

THE OPTIMAL BUNDLE: VOLUME 46

1.jpg

The Optimal Bundle is a student publication run by the Penn State Economics Association’s Print Education Committee.In this edition, our contributors dissect the economic motivations behind the protests in Iran, explore the effects of a tightening in the American labor market, analyze the craze behind cryptocurrencies and review Ben Bernanke's book The Courage to Act, which takes readers behind the scenes during the Financial Crisis.

This is an online version of the print edition.

Launch The Optimal Bundle

THE OPTIMAL BUNDLE: VOLUME 45

8284382027_dbfc103c82_b.jpg

The Optimal Bundle is a student publication run by the Penn State Economics Association’s Print Education Committee.In this Holiday edition, our contributors explore the effects of the rising costs for grocers and their competitors, the potential outcomes of Disney's purchase of 21st Century Fox, and how Americans budgeted their holiday shopping in an improving economy. In addition, our editor takes a brief look back at the most significant market and political developments of 2017.

This edition was published online.

Launch The Optimal Bundle


THE OPTIMAL BUNDLE: VOLUME 44

38078645425_afae67724e_b.jpg

The Optimal Bundle is a student publication run by the Penn State Economics Association’s Print Education Committee.This volume is the first in a revised and extended format. Our contributors explore the intrinsic value of Bitcoin, threats and opportunities for the recovery of the Eurozone, and the economic implications of Artificial Intelligence. We briefly overview new hacking scandals and a dawn of democracy in Zimbabwe. In addition, Irene Miller, executive director of the State College Downtown Development District, shares with The Optimal Bundle strategies that enhance investment and consumer traffic in the area. 

This is an online version of the print edition.

Launch The Optimal Bundle

A Conversation With Dr. Austin Boyle

d2c24cdd8d231baadf4bb7cdb8a3eb27.jpg

University Park, PennsylvaniaNovember 6, 2017Interviewed by Akram KhanThe Optimal Bundle and PSUEA would like to thank Akram Khan and especially Professor Boyle for his advice to students exploring or undergoing an academic career in economics.________

Dr. Austin Boyle is an Assistant Teaching Professor of Economics at the Pennsylvania State University - University Park.

Complementing his professional life, Dr. Boyle is an avid runner who has participated in multiple marathons, including a 50-mile ultra-marathon in town. He adopted a dog from Puerto Rico and is fluent in Spanish.

As an undergraduate, Boyle was tracking majors in chemistry and economics at Florida Atlantic University. He graduated Magna Cum Laude in economics, with just one class short of earning a major in Chemistry. While listening to career discussions by chemists and economists in their respective research interests, Boyle decided to pursue economics and went on to graduate school to earn a doctorate from Florida State University.

If you could go back and change anything in your life, what would that be?I only missed 2 classes in all of undergrad. I would miss a third one if I could to attend a lecture that James Watson* gave in 2005 at Florida Atlantic University. There are other things outside of classes that are so important to the college experience and while I was involved with a lot of clubs, I would say that whenever you have an opportunity to listen to a pioneer, you should take advantage of it – even if it’s not a requirement for your class or your major.James Watson is an American molecular biologist, who co-discovered the double helix structure of DNA in 1953

What advice would you give to students interested in pursuing Economics at the graduate level?The best advice I got going was not to memorize anything but to learn the underlying concept, rather to derive the solution through intuitive logic and thorough understating of the concepts. It may take longer on some instances but when encountering a new problem, you know you’ll get it right. And you hardly face the same classroom problem in real life. I always tell my students to not memorize that indifference curves are shaped convex to the origin but to learn why they have that shape.

What do you like the most about being a professor?Best part of the job is interacting with students who are full of energy and new ideas.At Penn State, there are so many students with very diverse backgrounds who bring a lot to any discussion. One time, we were having a discussion on sweatshops in class and there was a guy whose family worked in a sweatshop in El Salvador. Another time we were talking about hunting elephants in Africa and we had a Tanzanian student who talked about her experience with that. It’s really cool when students share their experience like that with the class and I know it’s tough especially since I teach such large classes. That’s the part I enjoy the most – I never know when someone will have a really great in-depth contribution to the class.

In your view, what is the most significant mistake students make in college? How can they correct it?On average, students not prioritizing their studies. They don’t use effective study strategy and hence spend more time studying while learning less than they could.Students should use effective study strategies like reading before you go to class so when you hear the lecture, it’s not brand new material. And before reading a chapter, ask yourself what you can learn from this lecture. That way you’ll actually retain more information.  After class take what notes you have from class and put them in your own words and relate it to your life – make it personal.

What is your most memorable moment at Penn State?When Leeland* was born, someone was covering class for me and I came in to finish the class and everybody applauded. That was nice.Leeland is Dr. Boyle’s second son. He is 10 months old at the time of this interview

Which professor do you most admire at Penn State and why?Bill Goffe*, because he’s always trying to gather evidence to help his students learn better and accordingly change how he teaches in the classroom.*William (Bill) Goffe is an Associate Teaching Professor of Economics at Penn State. He can be contacted at wlg13@psu.edu

For doctoral programmes, is it better to look at a good & reputed school, or a good & reputed professor you wish to work under?For PhD programmes, if you have a good & reputed professor you wish to work under, that takes precedence. Willing to take you under their wing and provide guidance, that’s more important. I went to Florida State, an institution that isn’t known for its overall economics department but it has a really good ‘Experimental Economics’ department and ‘Urban & Regional Economics’ department. If you are planning on being a specialist in an area, it’ll help to have that pedigree from that particular professor who’s an expert in the said field.

What books would you recommend students in order to develop an interest in economics?‘Freakonomics by Steven Levitt and Stephen J. Dubner’ and ‘Nudge by Richard Thaler & Cass Sunstein’ would be a good place to start.

What skills should students develop in order to succeed in the world after graduating from Penn State?Transfer – The ability to transfer what you learned in one situation and apply it in a new situation. You are rarely going to be provided with a same problem environment you had in class or an internship. You need to take the tools you have learned and figure our novel ways to combine them to solve new problems.

Thank you so much for your time Dr. Boyle.Pleasure talking to you, Akram.__________

untitled


Dr. Austin Boyle is an Assistant Professor at the Department of Economics of the Pennsylvania State Univeristy. He holds a Doctorate in Economics from Florida State University in Tallahassee and a Baccalaureate degree in Economics with minors in Chemistry and Spanish from the Harriet L. Wilkes Honors College at Florida Atlantic University. 


Akram Khan is a senior pursuing Bachelor of Science degrees in Economics, Applied Statistics, and Mathematics from the Pennsylvania State University.

The Optimal Bundle editorial team has made minor adjustments to the original transcript of this interview.

___________ 

Featured Image: Fog settles along Pattee Mall at the Pennsylvania State University.

Photo Credit: Tina Hay


THE OPTIMAL BUNDLE: VOLUME 43

1050181_1_1103-jerome-powell_standard.jpg

The Optimal Bundle is a student publication run by the Penn State Economics Association’s Print Education Committee.This volume provides economic news updates. Topics covered include a look at the A look at President Trump's nomination of Jerome Powell as Chair of the Board of Governors, sweeping corruption crackdowns in Saudi Arabia, a quick background on the Bank of England's increase in interest rates, and a perspective on Republicans' stance on deficits.

This is an online version of the print edition.

Launch The Optimal Bundle